Question: Each tab within the workbook contains the actual data for 2004-2007 along with the budget for 2008. The actual data from the previous years is
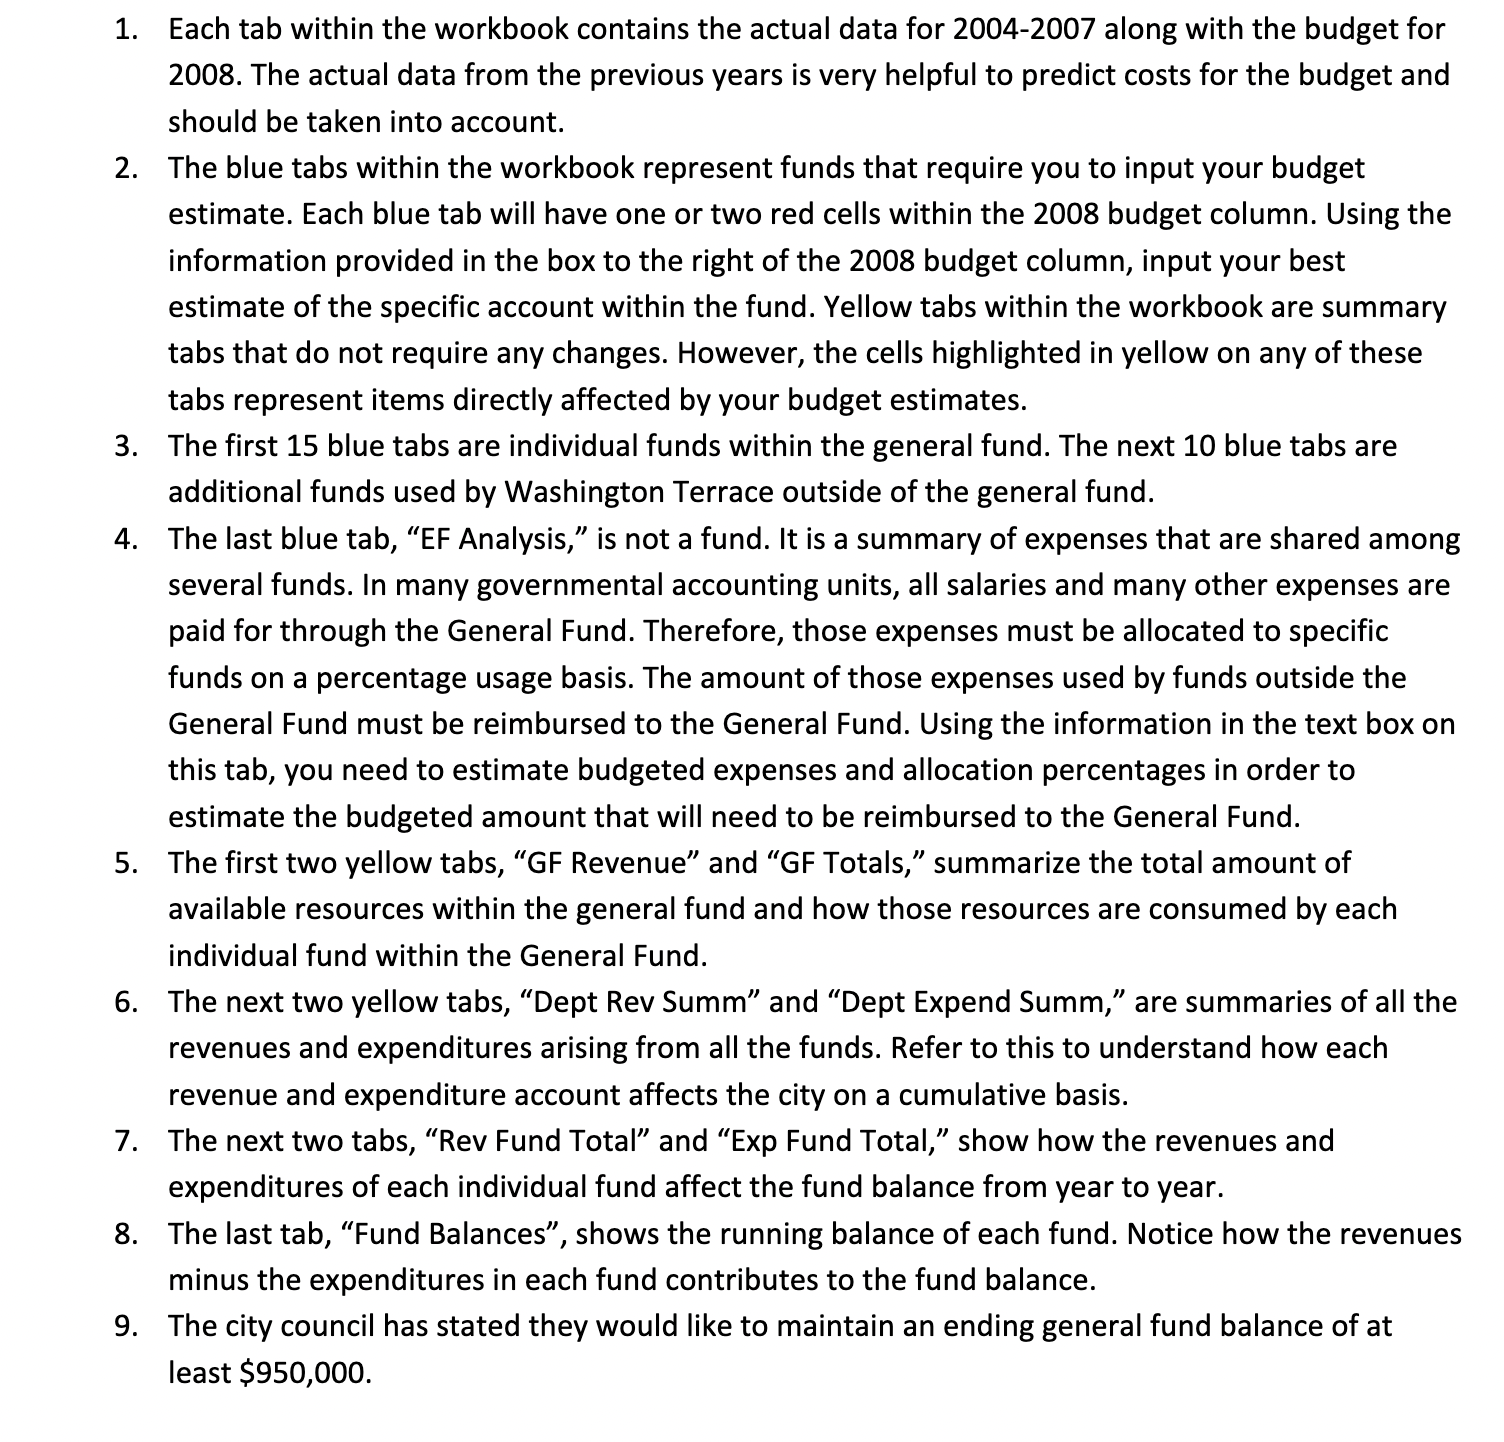
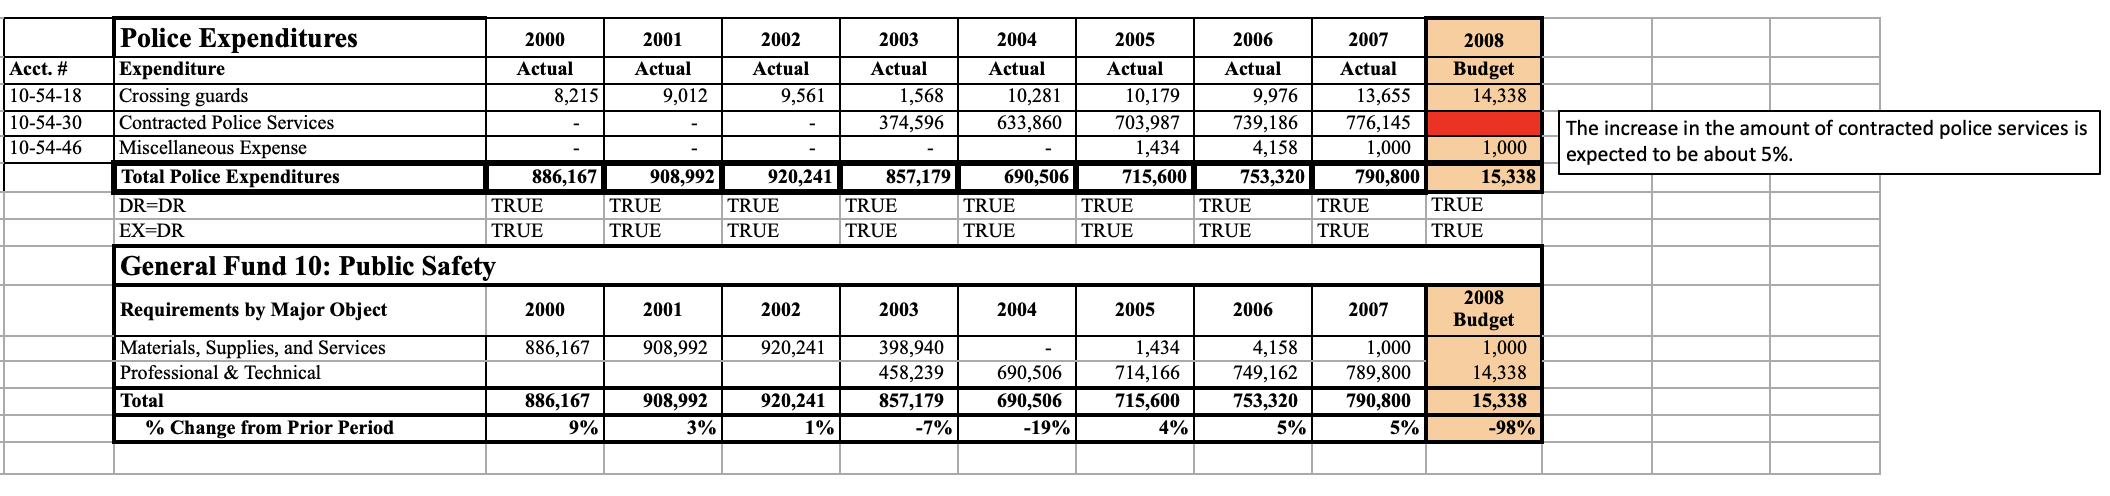
Each tab within the workbook contains the actual data for 2004-2007 along with the budget for 2008. The actual data from the previous years is very helpful to predict costs for the budget and should be taken into account. The blue tabs within the workbook represent funds that require you to input your budget estimate. Each blue tab will have one or two red cells within the 2008 budget column. Using the information provided in the box to the right of the 2008 budget column, input your best estimate of the specific account within the fund. Yellow tabs within the workbook are summary tabs that do not require any changes. However, the cells highlighted in yellow on any of these tabs represent items directly affected by your budget estimates. The first 15 blue tabs are individual funds within the general fund. The next 10 blue tabs are additional funds used by Washington Terrace outside of the general fund. The last blue tab, "EF Analysis,\" is not a fund. It is a summary of expenses that are shared among several funds. In many governmental accounting units, all salaries and many other expenses are paid for through the General Fund. Therefore, those expenses must be allocated to specific funds on a percentage usage basis. The amount of those expenses used by funds outside the General Fund must be reimbursed to the General Fund. Using the information in the text box on this tab, you need to estimate budgeted expenses and allocation percentages in order to estimate the budgeted amount that will need to be reimbursed to the General Fund. The first two yellow tabs, \"GF Revenue\" and \"GF Totals,\" summarize the total amount of available resources within the general fund and how those resources are consumed by each individual fund within the General Fund. The next two yellow tabs, \"Dept Rev Summ\" and "Dept Expend Summ,\" are summaries of all the revenues and expenditures arising from all the funds. Refer to this to understand how each revenue and expenditure account affects the city on a cumulative basis. The next two tabs, \"Rev Fund Total\" and \"Exp Fund Total,\" show how the revenues and expenditures of each individual fund affect the fund balance from year to year. The last tab, "Fund Balances\Police Expenditures 2000 2001 2002 2003 2004 2005 2006 2007 2008 Acct. # Expenditure Actual Actual Actual Actual Actual Actual Actual Actual Budget 10-54-18 Crossing guards 3,215 9,012 9.561 1,568 0,281 10,179 9,976 3.655 14,338 10-54-30 Contracted Police Services 374,596 633,860 703,987 739,186 776,145 10-54-46 Miscellaneous Expense The increase in the amount of contracted police services is ,434 4,158 1,000 1,000 expected to be about 5%. Total Police Expenditures 386,167 908,992 20,241 357,179 690,506 715,600 753,320 790,800 15,338 DR=DR TRUE TRUE TRUE TRUE TRUE TRUE TRUE TRUE TRUE EX=DR TRUE TRUE TRUE TRUE TRUE TRUE TRUE TRUE TRUE General Fund 10: Public Safety Requirements by Major Object 2000 2001 2002 2003 2004 2005 2006 2007 2008 Budget Materials, Supplies, and Services 886,167 908,992 920,241 398,940 1,434 4,158 1,000 ,000 Professional & Technical 458,239 690,506 714,166 749,162 789,800 14,338 Total 386,167 908,992 920,241 857,179 690,506 715,600 753,320 790,800 15,338 % Change from Prior Period 9% 3% 1% -7% 19% 4% 5% 5% -98%
Step by Step Solution
There are 3 Steps involved in it
1 Expert Approved Answer
Step: 1 Unlock
Question Has Been Solved by an Expert!
Get step-by-step solutions from verified subject matter experts
Step: 2 Unlock
Step: 3 Unlock
Students Have Also Explored These Related Accounting Questions!