

Question: Each working week, three specimens are randomly selected from a production line for quality control testing. (a) Using the all the data, find trial control
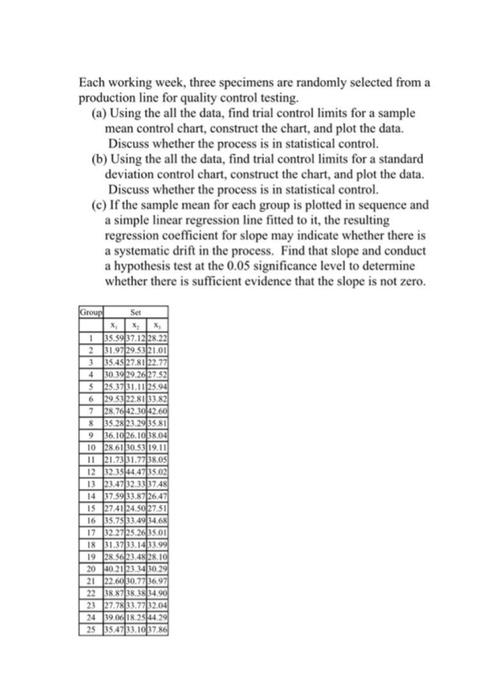
Each working week, three specimens are randomly selected from a production line for quality control testing. (a) Using the all the data, find trial control limits for a sample mean control chart, construct the chart, and plot the data. Discuss whether the process is in statistical control. (b) Using the all the data, find trial control limits for a standard deviation control chart, construct the chart, and plot the data. Discuss whether the process is in statistical control. (c) If the sample mean for each group is plotted in sequence and a simple linear regression line fitted to it, the resulting regression coefficient for slope may indicate whether there is a systematic drift in the process. Find that slope and conduct a hypothesis test at the 0.05 significance level to determine whether there is sufficient evidence that the slope is not zero. Group Set 135.59 37.12 28.22 2 31.9729.53 21.01 3 35.4527.81 22.77 4 30.39 29.2627.52 5 25.37 31.11 25.94 6 29.53 22.81 33.82 7 28.76 42.30 42.60 8 35.28 23.2935.81 9 36.10 26.1038.04 10 28.61 30.53 19.11 11 21.73 31.77 38.05 12 32.35 44.47 15.02 13 23.47 32.33 37.48 14 37.59 33.87 26.47 15 27.41 24.5027.51 16 35.75 33.49 34.68 17 32.2725.2615.01 18 31.37 33.1433.99 19 28 5623.48 28.10 20 40 21 23 3430.29 21 22.60 30.77 36.97 22 38.87 38.38 34.90 23 27.78 33.77 32.04 24 39 06 18 25 44.29 25 35.47 33.10 37.86 Each working week, three specimens are randomly selected from a production line for quality control testing. (a) Using the all the data, find trial control limits for a sample mean control chart, construct the chart, and plot the data. Discuss whether the process is in statistical control. (b) Using the all the data, find trial control limits for a standard deviation control chart, construct the chart, and plot the data. Discuss whether the process is in statistical control. (c) If the sample mean for each group is plotted in sequence and a simple linear regression line fitted to it, the resulting regression coefficient for slope may indicate whether there is a systematic drift in the process. Find that slope and conduct a hypothesis test at the 0.05 significance level to determine whether there is sufficient evidence that the slope is not zero. Group Set 135.59 37.12 28.22 2 31.9729.53 21.01 3 35.4527.81 22.77 4 30.39 29.2627.52 5 25.37 31.11 25.94 6 29.53 22.81 33.82 7 28.76 42.30 42.60 8 35.28 23.2935.81 9 36.10 26.1038.04 10 28.61 30.53 19.11 11 21.73 31.77 38.05 12 32.35 44.47 15.02 13 23.47 32.33 37.48 14 37.59 33.87 26.47 15 27.41 24.5027.51 16 35.75 33.49 34.68 17 32.2725.2615.01 18 31.37 33.1433.99 19 28 5623.48 28.10 20 40 21 23 3430.29 21 22.60 30.77 36.97 22 38.87 38.38 34.90 23 27.78 33.77 32.04 24 39 06 18 25 44.29 25 35.47 33.10 37.86
Step by Step Solution
There are 3 Steps involved in it

Get step-by-step solutions from verified subject matter experts