

Question: EASY ONE MC QUESTION The graph below displays the probability distribution for the probability of July temperatures in Toronto on the interval 250-350. What is
EASY ONE MC QUESTION
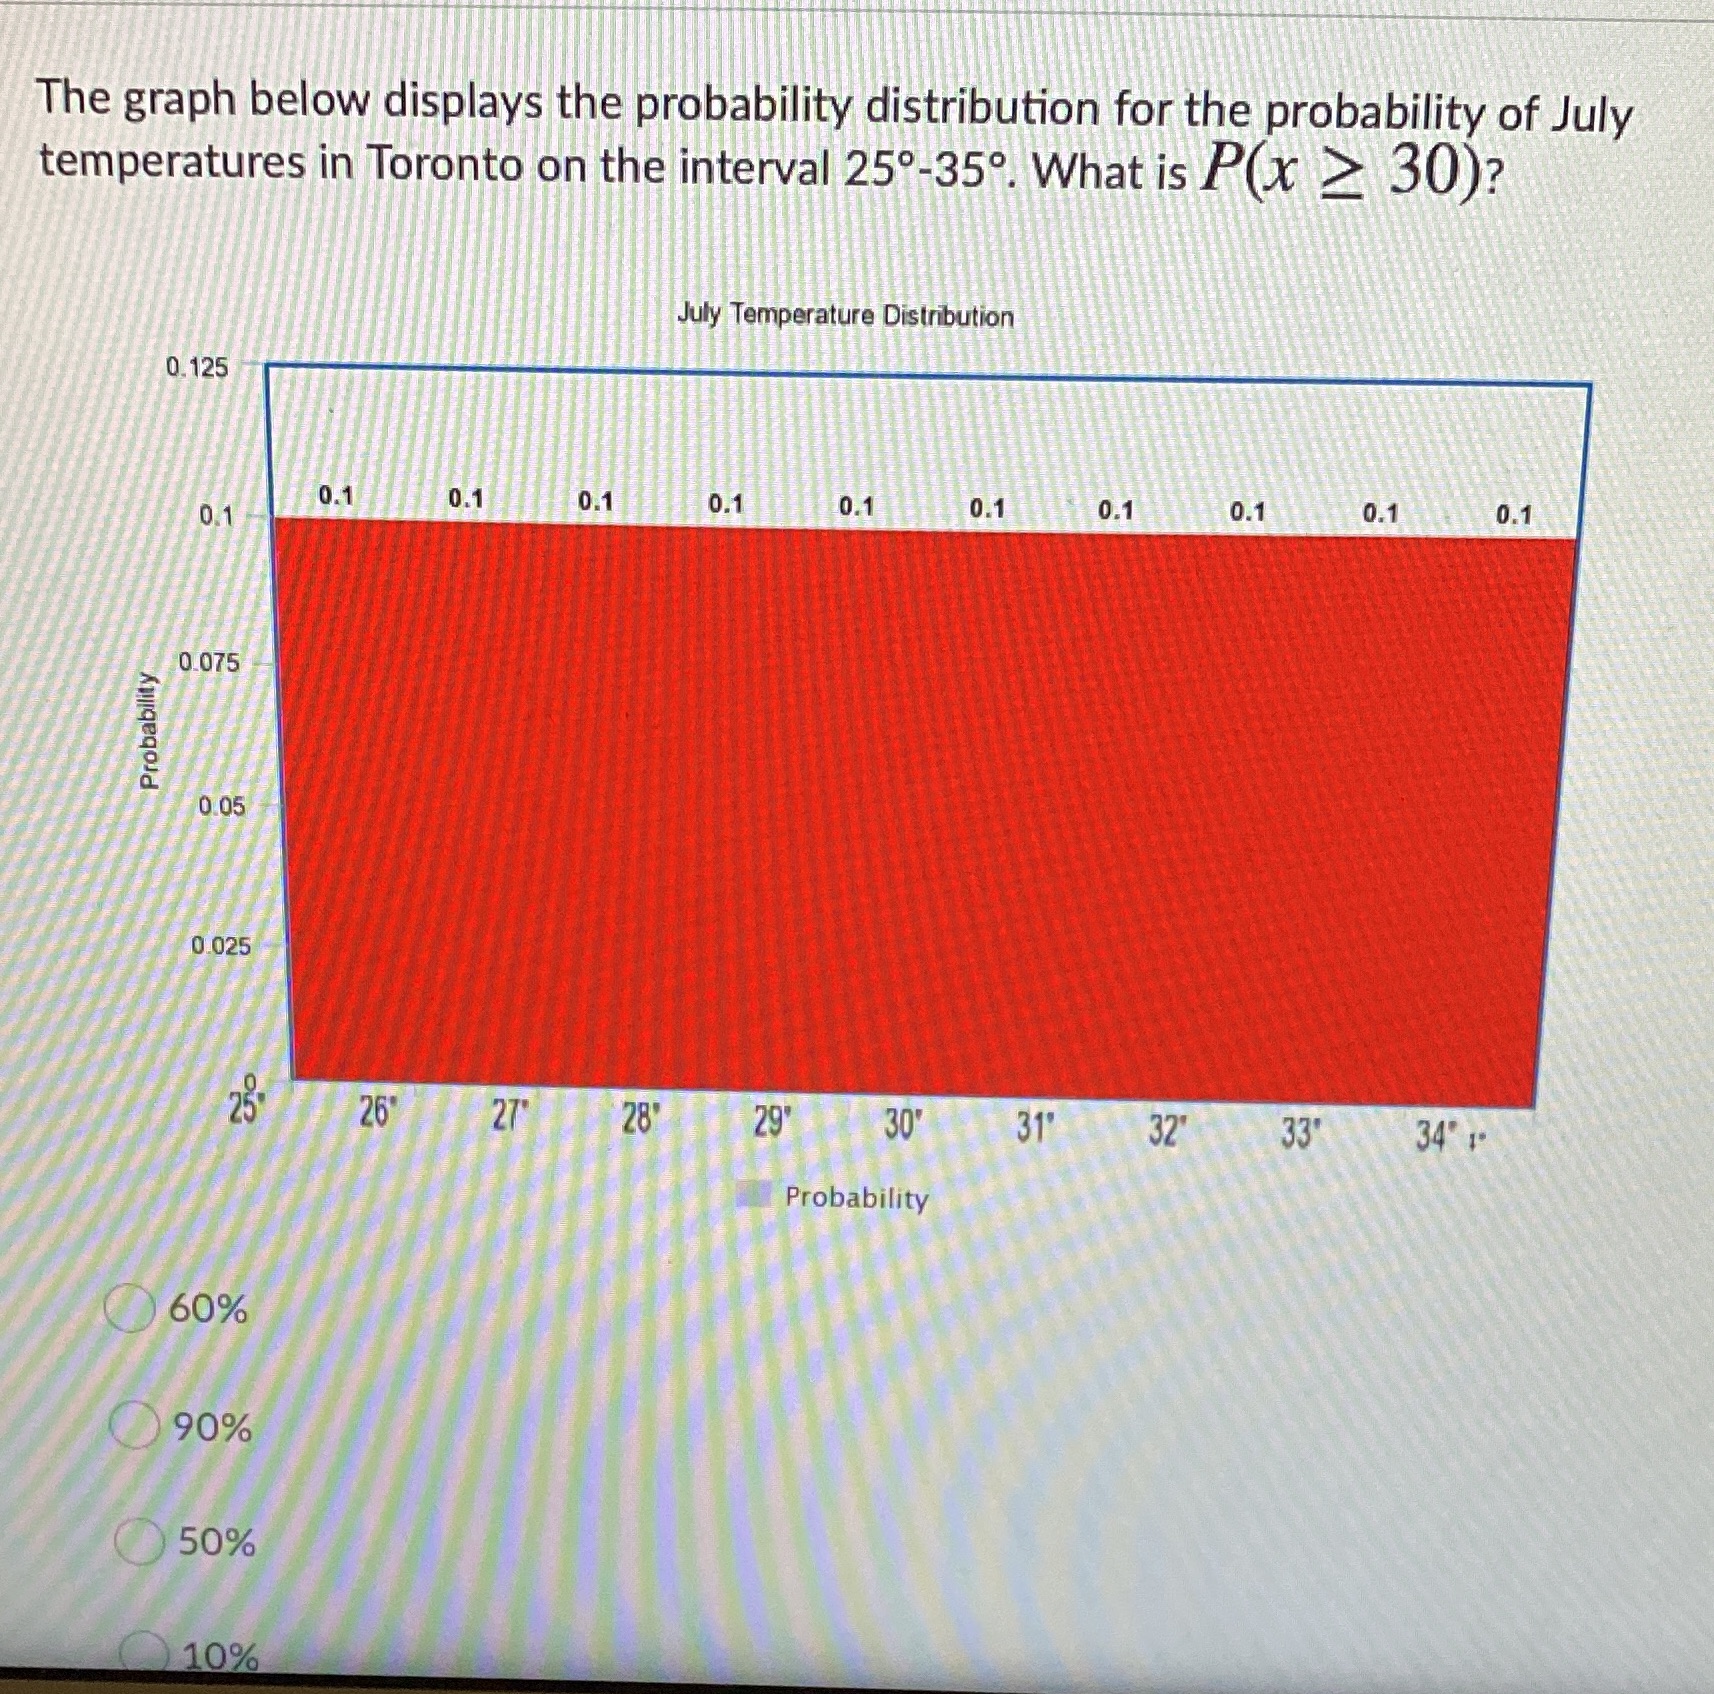
The graph below displays the probability distribution for the probability of July temperatures in Toronto on the interval 250-350. What is P(x 2 30)? July Temperature Distribution 0. 125 0.1 0.1 0.1 0.1 0.1 0.1 0.1 0.1 0.1 0.1 0.1 0.075 Probability .05 0.025 25' 26' 27' 28' 29' 30' 31 32' 33' 34' 1 Probability 60% 90% 50% 10%
Step by Step Solution
There are 3 Steps involved in it
1 Expert Approved Answer
Step: 1 Unlock

Question Has Been Solved by an Expert!
Get step-by-step solutions from verified subject matter experts
Step: 2 Unlock
Step: 3 Unlock