

Question: EBIT-EPS and capital structure Data-Check is considering two capital structures. The key information is shown in the following table. Assume a 40% tax rate. Source
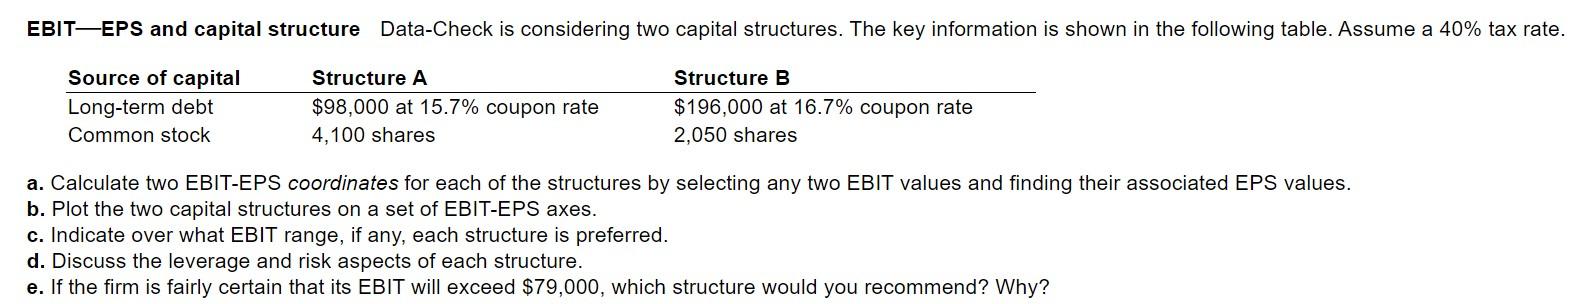
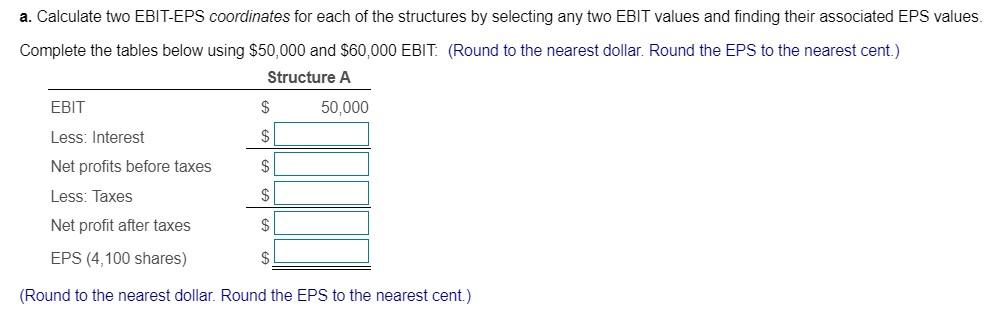
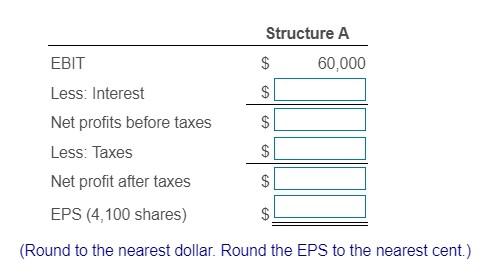
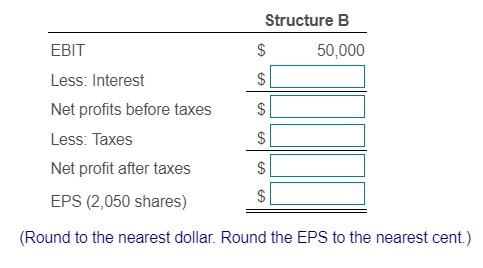
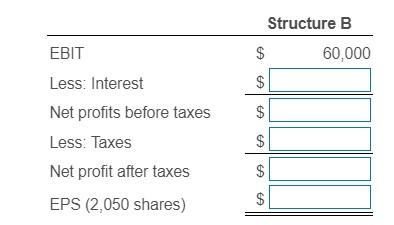
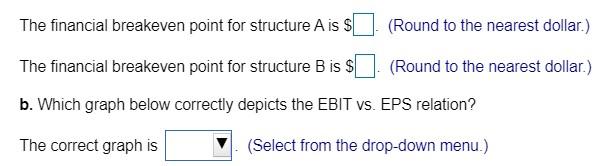
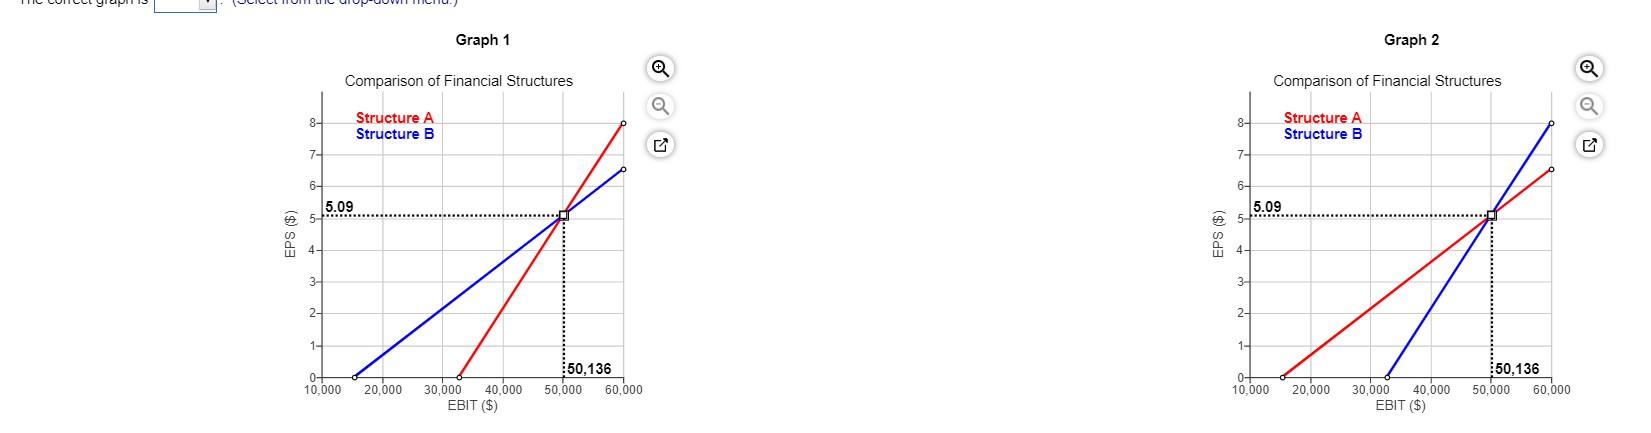
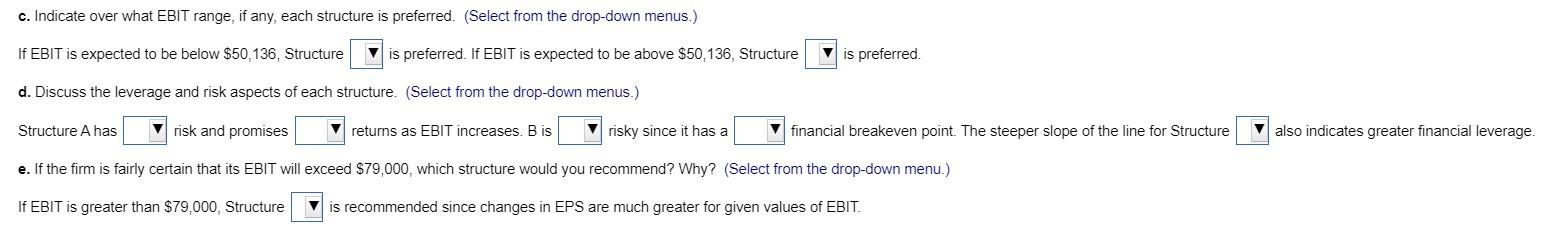
EBIT-EPS and capital structure Data-Check is considering two capital structures. The key information is shown in the following table. Assume a 40% tax rate. Source of capital Long-term debt Common stock Structure A $98,000 at 15.7% coupon rate 4,100 shares Structure B $196,000 at 16.7% coupon rate 2,050 shares a. Calculate two EBIT-EPS coordinates for each of the structures by selecting any two EBIT values and finding their associated EPS values. b. Plot the two capital structures on a set of EBIT-EPS axes. c. Indicate over what EBIT range, if any, each structure is preferred. d. Discuss the leverage and risk aspects of each structure. e. If the firm is fairly certain that its EBIT will exceed $79,000, which structure would you recommend? Why? a. Calculate two EBIT-EPS coordinates for each of the structures by selecting any two EBIT values and finding their associated EPS values. Complete the tables below using $50,000 and $60,000 EBIT: (Round to the nearest dollar. Round the EPS to the nearest cent.) Structure A EBIT $ 50,000 Less: Interest Net profits before taxes $ $ Less: Taxes Net profit after taxes EPS (4,100 shares) (Round to the nearest dollar. Round the EPS to the nearest cent.) Structure A 60,000 $ $ EBIT Less: Interest Net profits before taxes Less: Taxes Net profit after taxes EPS (4,100 shares) $ $ $ (Round to the nearest dollar. Round the EPS to the nearest cent.) $ Structure B EBIT $ 50,000 Less: Interest $ Net profits before taxes Less: Taxes $ Net profit after taxes EPS (2,050 shares) (Round to the nearest dollar. Round the EPS to the nearest cent.) $ $ $ $ Structure B EBIT $ 60,000 $ Less: Interest Net profits before taxes Less: Taxes Net profit after taxes EPS (2,050 shares) $ $ $ The financial breakeven point for structure A is $ (Round to the nearest dollar.) The financial breakeven point for structure B is $ (Round to the nearest dollar.) b. Which graph below correctly depicts the EBIT vs. EPS relation? The correct graph is (Select from the drop-down menu.) Graph 1 Graph 2 Comparison of Financial Structures Comparison of Financial Structures 8- Structure A Structure B 8- Structure A Structure B 7- 7- 6- 6- 5.09 5- 5.09 5 EPS ($) 4- 3- 3- 2- 2- 1- 1- 0- 10,000 20,000 30,000 40.000 EBIT ($) 50,136 50,000 60,000 0- 10,000 20,000 50,136 50,000 60,000 30,000 40.000 EBIT ($) c. Indicate over what EBIT range, if any, each structure is preferred. (Select from the drop-down menus.) If EBIT is expected to be below $50,136, Structure V is preferred. If EBIT is expected to be above $50,136, Structure V is preferred d. Discuss the leverage and risk aspects of each structure. (Select from the drop-down menus.) Structure A has v risk and promises returns as EBIT increases. B is risky since has a financial breakeven point. The steeper slope of the line for Structure also indicates greater financial leverage e. If the firm is fairly certain that its EBIT will exceed $79,000, which structure would you recommend? Why? (Select from the drop-down menu.) If EBIT is greater than $79,000, Structure V is recommended since changes in EPS are much greater for given values of EBIT. EBIT-EPS and capital structure Data-Check is considering two capital structures. The key information is shown in the following table. Assume a 40% tax rate. Source of capital Long-term debt Common stock Structure A $98,000 at 15.7% coupon rate 4,100 shares Structure B $196,000 at 16.7% coupon rate 2,050 shares a. Calculate two EBIT-EPS coordinates for each of the structures by selecting any two EBIT values and finding their associated EPS values. b. Plot the two capital structures on a set of EBIT-EPS axes. c. Indicate over what EBIT range, if any, each structure is preferred. d. Discuss the leverage and risk aspects of each structure. e. If the firm is fairly certain that its EBIT will exceed $79,000, which structure would you recommend? Why? a. Calculate two EBIT-EPS coordinates for each of the structures by selecting any two EBIT values and finding their associated EPS values. Complete the tables below using $50,000 and $60,000 EBIT: (Round to the nearest dollar. Round the EPS to the nearest cent.) Structure A EBIT $ 50,000 Less: Interest Net profits before taxes $ $ Less: Taxes Net profit after taxes EPS (4,100 shares) (Round to the nearest dollar. Round the EPS to the nearest cent.) Structure A 60,000 $ $ EBIT Less: Interest Net profits before taxes Less: Taxes Net profit after taxes EPS (4,100 shares) $ $ $ (Round to the nearest dollar. Round the EPS to the nearest cent.) $ Structure B EBIT $ 50,000 Less: Interest $ Net profits before taxes Less: Taxes $ Net profit after taxes EPS (2,050 shares) (Round to the nearest dollar. Round the EPS to the nearest cent.) $ $ $ $ Structure B EBIT $ 60,000 $ Less: Interest Net profits before taxes Less: Taxes Net profit after taxes EPS (2,050 shares) $ $ $ The financial breakeven point for structure A is $ (Round to the nearest dollar.) The financial breakeven point for structure B is $ (Round to the nearest dollar.) b. Which graph below correctly depicts the EBIT vs. EPS relation? The correct graph is (Select from the drop-down menu.) Graph 1 Graph 2 Comparison of Financial Structures Comparison of Financial Structures 8- Structure A Structure B 8- Structure A Structure B 7- 7- 6- 6- 5.09 5- 5.09 5 EPS ($) 4- 3- 3- 2- 2- 1- 1- 0- 10,000 20,000 30,000 40.000 EBIT ($) 50,136 50,000 60,000 0- 10,000 20,000 50,136 50,000 60,000 30,000 40.000 EBIT ($) c. Indicate over what EBIT range, if any, each structure is preferred. (Select from the drop-down menus.) If EBIT is expected to be below $50,136, Structure V is preferred. If EBIT is expected to be above $50,136, Structure V is preferred d. Discuss the leverage and risk aspects of each structure. (Select from the drop-down menus.) Structure A has v risk and promises returns as EBIT increases. B is risky since has a financial breakeven point. The steeper slope of the line for Structure also indicates greater financial leverage e. If the firm is fairly certain that its EBIT will exceed $79,000, which structure would you recommend? Why? (Select from the drop-down menu.) If EBIT is greater than $79,000, Structure V is recommended since changes in EPS are much greater for given values of EBIT
Step by Step Solution
There are 3 Steps involved in it

Get step-by-step solutions from verified subject matter experts