

Question: EBOS Group Ltd (EBO.NZ) Expected Return (Monthly) Annualised Expected Return 1.20% 14.42% Standard Deviation (Monthly) Annualised Standard Deviation 5.11% 17.69% Auckland International Airport Ltd (AIA.NZ)
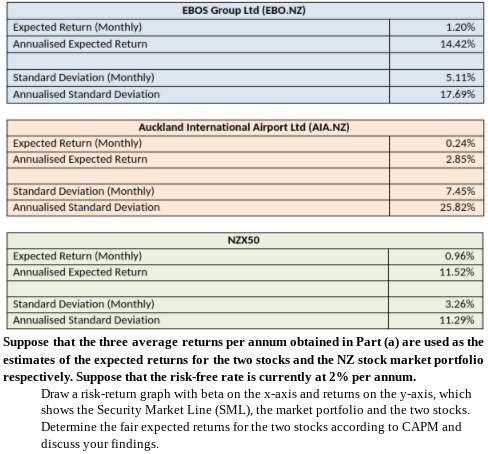
EBOS Group Ltd (EBO.NZ) Expected Return (Monthly) Annualised Expected Return 1.20% 14.42% Standard Deviation (Monthly) Annualised Standard Deviation 5.11% 17.69% Auckland International Airport Ltd (AIA.NZ) Expected Return (Monthly) Annualised Expected Return 0.24% 2.85% Standard Deviation (Monthly) Annualised Standard Deviation 7.45% 25.82% NZX50 Expected Return (Monthly) Annualised Expected Return 0.96% 11.52% Standard Deviation (Monthly) 3.26% Annualised Standard Deviation 11.29% Suppose that the three average returns per annum obtained in Part (a) are used as the estimates of the expected returns for the two stocks and the NZ stock market portfolio respectively. Suppose that the risk-free rate is currently at 2% per annum. Draw a risk-return graph with beta on the x-axis and returns on the y-axis, which shows the Security Market Line (SML), the market portfolio and the two stocks. Determine the fair expected returns for the two stocks according to CAPM and discuss your findings. EBOS Group Ltd (EBO.NZ) Expected Return (Monthly) Annualised Expected Return 1.20% 14.42% Standard Deviation (Monthly) Annualised Standard Deviation 5.11% 17.69% Auckland International Airport Ltd (AIA.NZ) Expected Return (Monthly) Annualised Expected Return 0.24% 2.85% Standard Deviation (Monthly) Annualised Standard Deviation 7.45% 25.82% NZX50 Expected Return (Monthly) Annualised Expected Return 0.96% 11.52% Standard Deviation (Monthly) 3.26% Annualised Standard Deviation 11.29% Suppose that the three average returns per annum obtained in Part (a) are used as the estimates of the expected returns for the two stocks and the NZ stock market portfolio respectively. Suppose that the risk-free rate is currently at 2% per annum. Draw a risk-return graph with beta on the x-axis and returns on the y-axis, which shows the Security Market Line (SML), the market portfolio and the two stocks. Determine the fair expected returns for the two stocks according to CAPM and discuss your findings
Step by Step Solution
There are 3 Steps involved in it

Get step-by-step solutions from verified subject matter experts