

Question: EC 202 - Aggregate Demand / Aggregate Supply Research Assignment Part I:Find Current RGDP Data Step 1: Go to the following the BEA National Income
EC 202 - Aggregate Demand / Aggregate Supply Research Assignment
Part I:Find Current RGDP Data
Step 1:Go to the following the BEA National Income and Product Accounts data pageand select "Begin using the data":https://apps.bea.gov/iTable/index_nipa.cfm
Step 2:Choose "Section 1 - Domestic Product and Income".Note:You will use information fromTable 1.1.6to fill out your data table in Part II of this assignment.
Tips on How to read the data:The data shown is for RGDP and is reported in billions of dollars.For example, in Q4 2018 RGDP was $18,783.5 billion dollars or about $18.8 Trillion.
Part II:Record RGDP Data
Use information from tables 1.1.6 on the BEA website to fill in this table and answer the questions below.
$ Value RGDP Q4 2019 : ___________________
$ Value RGDP Q1 2020:: ___________________
$ Value RGDP Q2 2020: : ___________________
$ Value RGDP Q3 2020: : ___________________
1.How much did RGDP fall between Q1 and Q2 in 2020?
2.How much less was RGDP in Q3 2020 than Q1 2020?
3.Make a graph:
Step 1:Click on the "Chart" button on the right-hand top of the page in table 1.1.6
Step 2:Select "Gross Domestic Product" from the menu on the left hand side.
1.Insert a screen shot of your chart here or take a photo of your graph and submit as a separate file with your assignment submission.
2.Recall the labels used to represent the business cycle.What quarter was the peak in the graph?
3.What quarter was the trough?
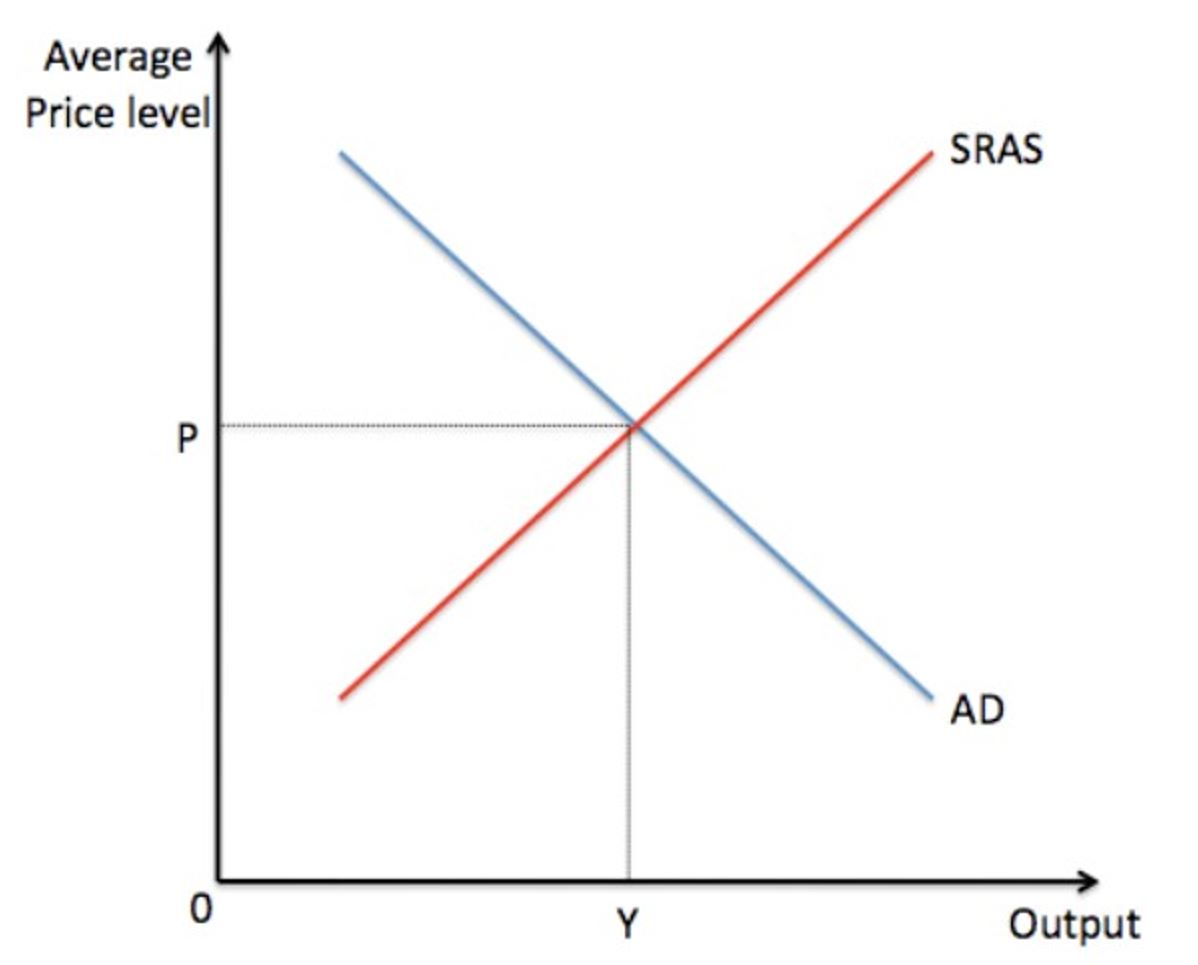
Part III - Use the AD - AS Model to Illustrate
Use this graph of Aggregate Demand and Short-Run Aggregate Supply to illustrate the changes to AD, SRAS, RGDP and the price level due to the Covid-19 pandemic.
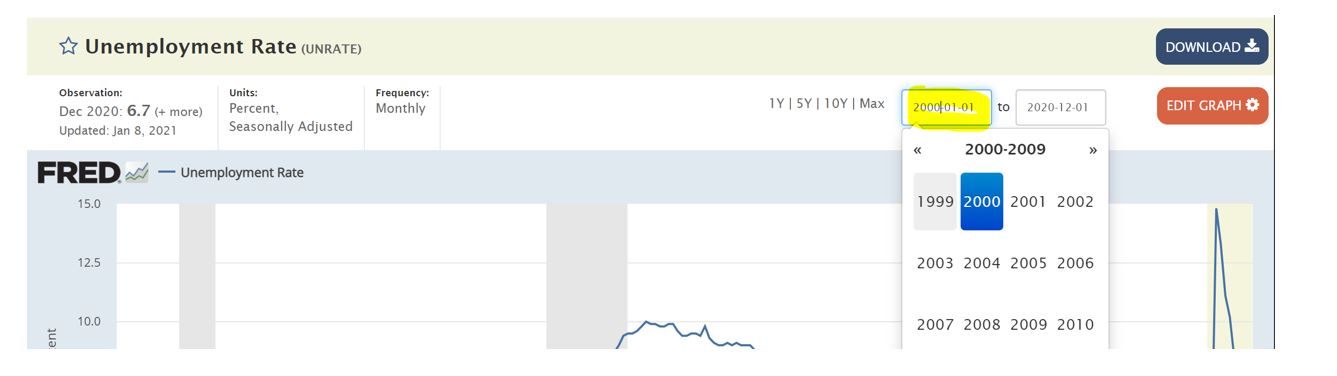
\fUnemployment Rate (UNRATE) DOWNLOAD Observation: Units: Frequency: Dec 2020: 6.7 (+ more) Percent, Monthly 1Y | 5Y | 10Y | Max 2000 01-01 to 2020-12-01 EDIT GRAPH * Updated: Jan 8, 2021 Seasonally Adjusted 2000-2009 FRED ~ - Unemployment Rate 15.0 1999 2000 2001 2002 12.5 2003 2004 2005 2006 10.0 2007 2008 2009 2010 ent
Step by Step Solution
There are 3 Steps involved in it

Get step-by-step solutions from verified subject matter experts