

Question: EC V 71% e @ 0 Q e R ng.cengage.com C a + SE Q Illinois state Univer... '1' MindTap - Cengage... u Course Hero
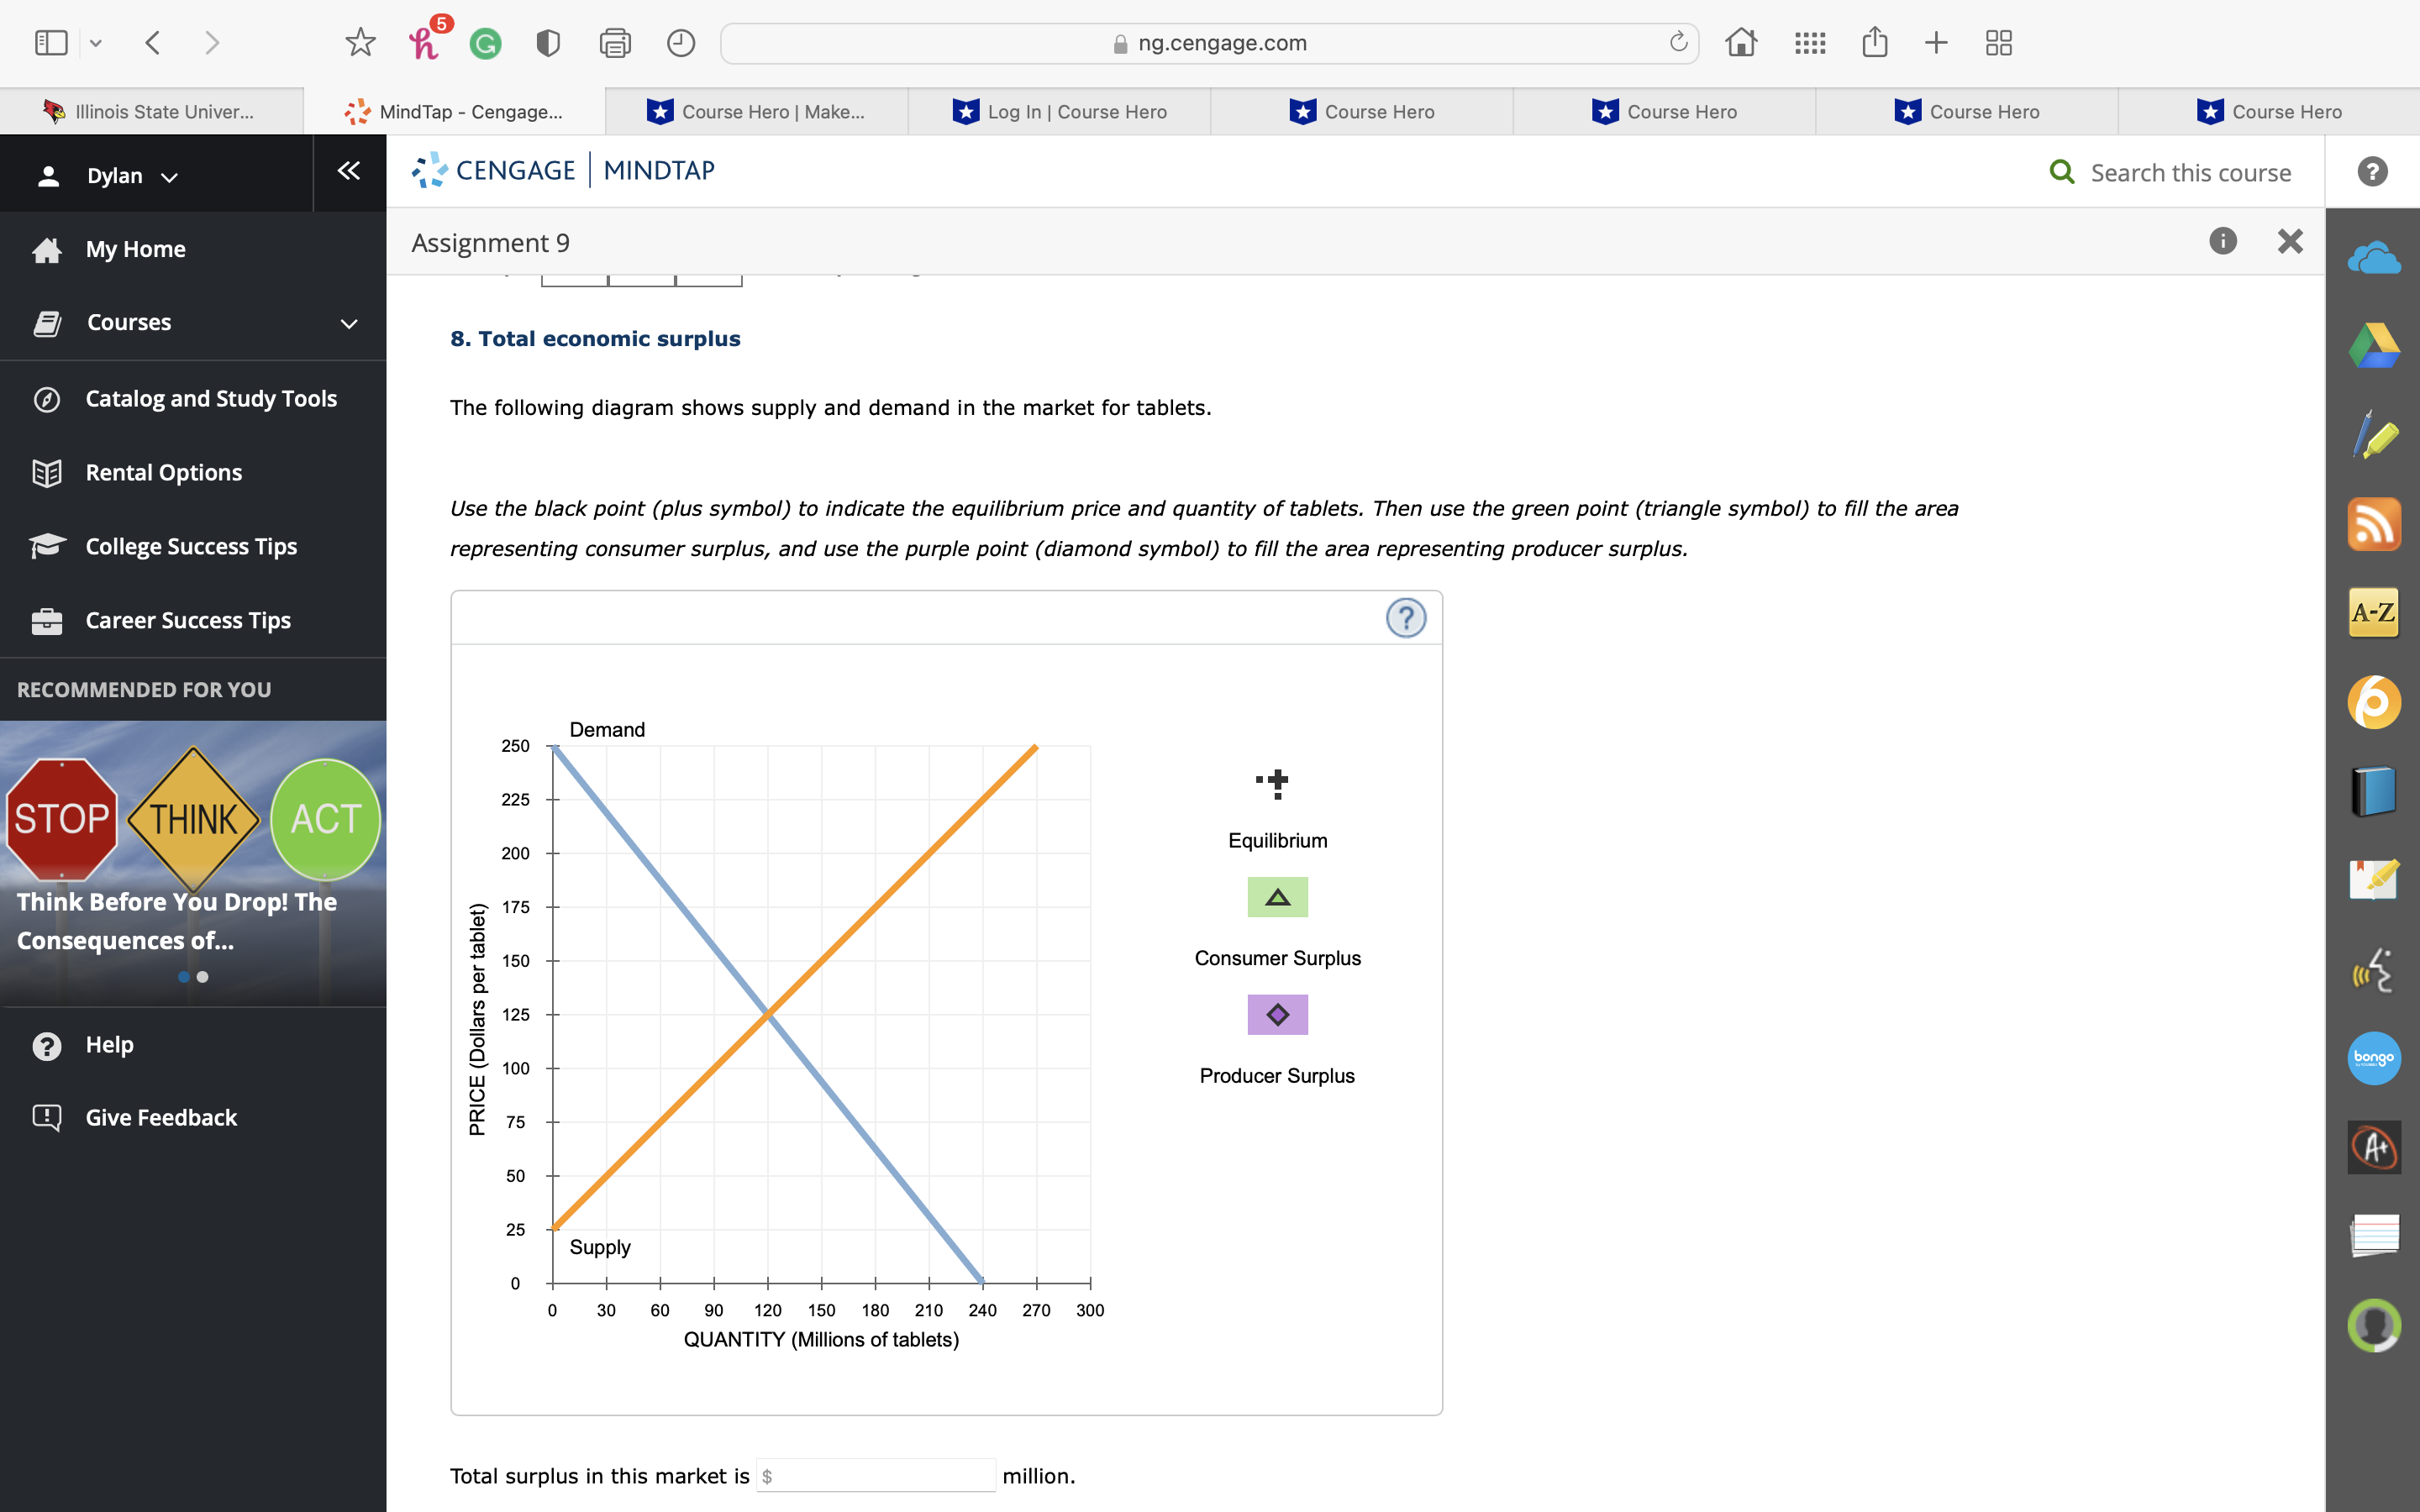
EC V 71% e @ 0 Q e R ng.cengage.com C a + SE Q Illinois state Univer... '1' MindTap - Cengage... u Course Hero | Make... u Log In | Course Hero u Course Here n Course Hero u Course Hero u Course Hero Dylan V '2: CENGAGE | MINDTAP Q Search this course My Home Assignment 9 o X , . Courses _ 8. Total economlc surplus Catalog and Study TIs The following diagram shows supply and demand in the market for tablets. Rental Options Use the black paint (plus symbol) to indicate the equilibrium price and quantity of tablets. Then use the green point (triangle symbol) to ll the area College Success Tips representing consumer surplus, and use the purple point (diamond symbol) to ll the area representing producer surplus. Career Success Tips Demand 250 "l- 225 - 200 Equilibrium Think Before You Drop! The 3 175 A 2 Consequences of... R : 150 Consumer Surplus ' a 9 Help 5: u.| 10 Producer Surplus o E] Give Feedback E 75 50 25 0 . r . . r . r . r 0 30 60 90 120 150 130 210 240 270 300 QUANTITY (Millions of tablets) Total surplus in this market is $ million
Step by Step Solution
There are 3 Steps involved in it

Get step-by-step solutions from verified subject matter experts