

Question: eCampusOntario would also like to know if differences exist between the satisfaction levels of nursing students, business students and education students during stage 2 .
- eCampusOntario would also like to know if differences exist between the satisfaction levels ofnursing students, business students and education studentsduringstage 2. Do differences exist? Assume the variables have equal variance.
i. State your chosen method of analysis and justify its use. If the question involves testing a hypothesis, state the hypotheses.
ii. State the required conditions for all tests performed and whether they are satisfied, justifying your answer with any necessary analysis.
iii. Briefly discuss how the findings can help eCampusOntario in future decision making.
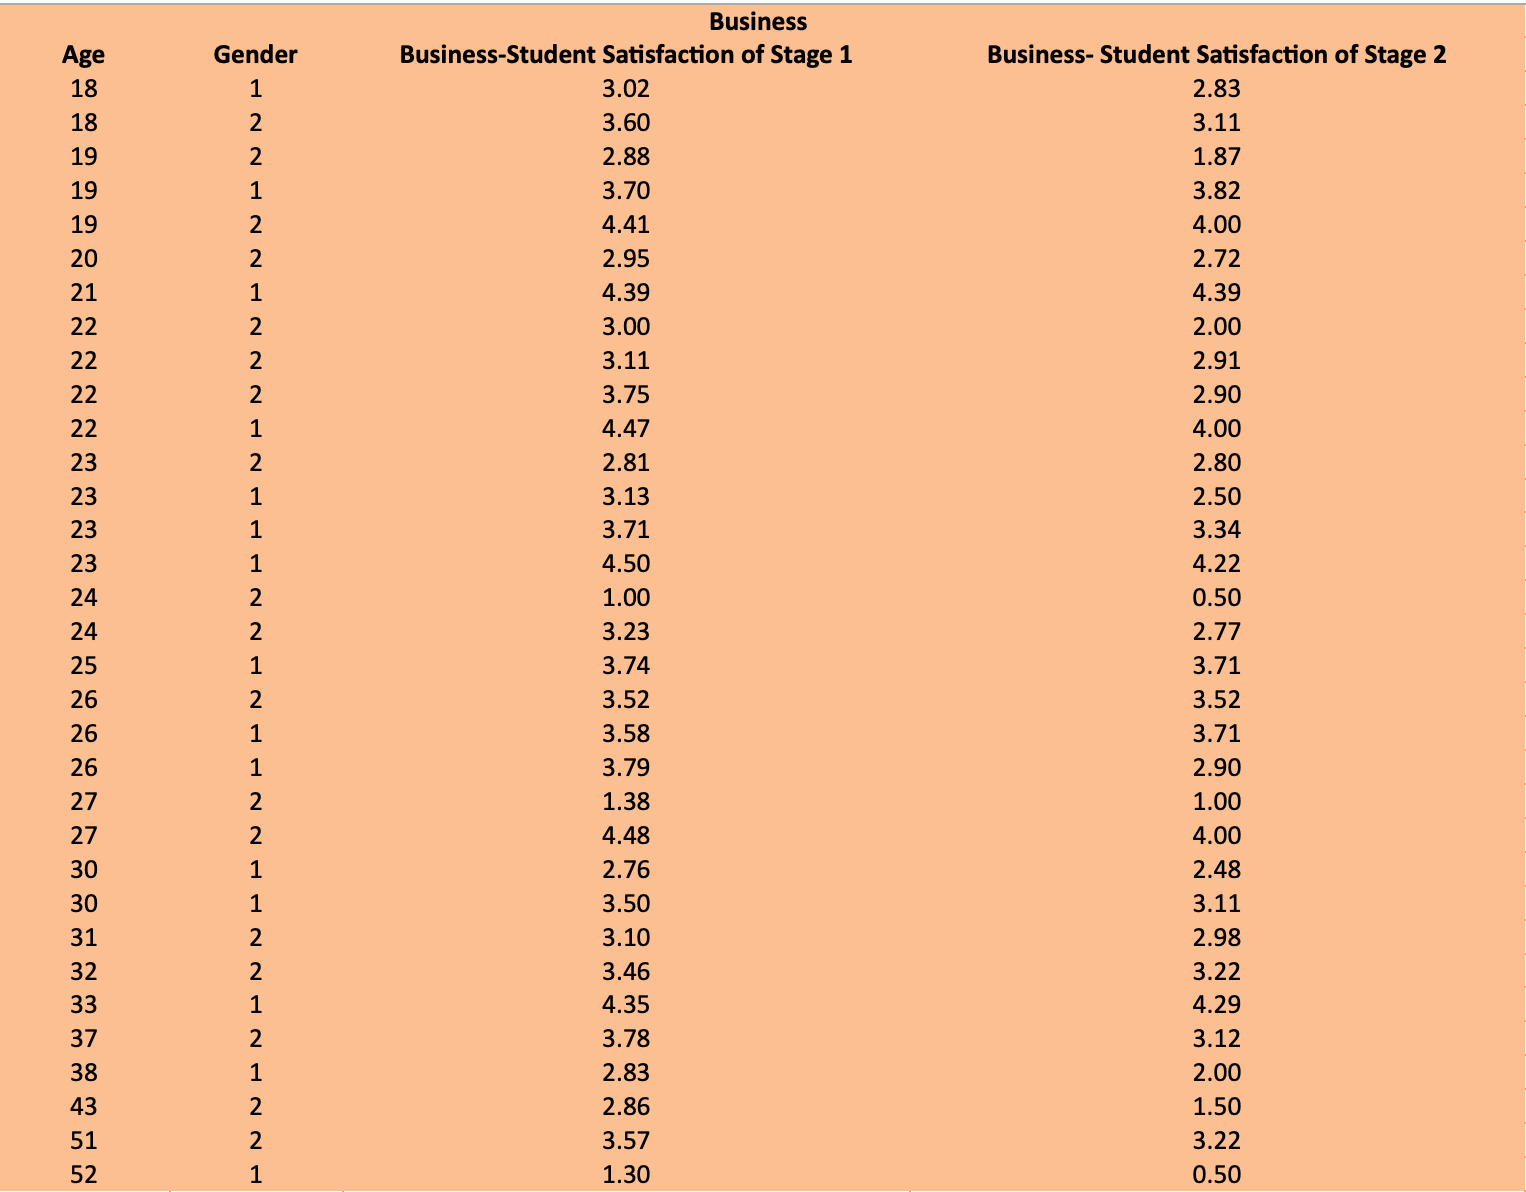
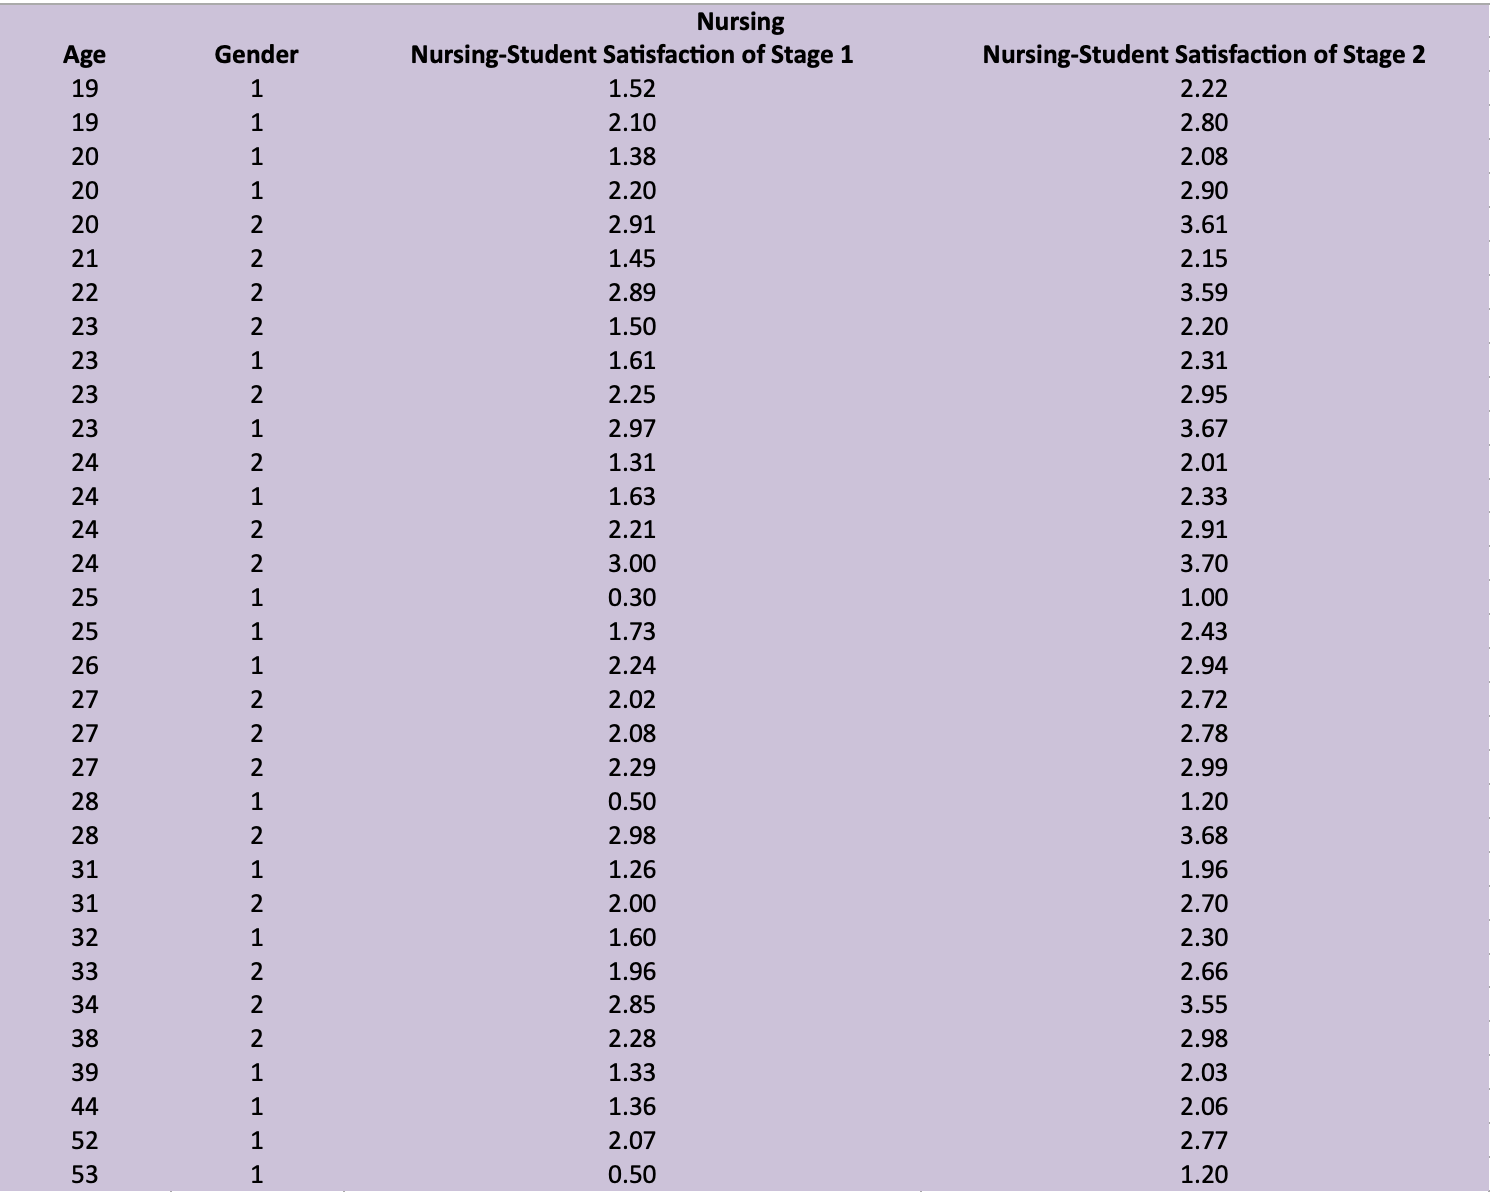
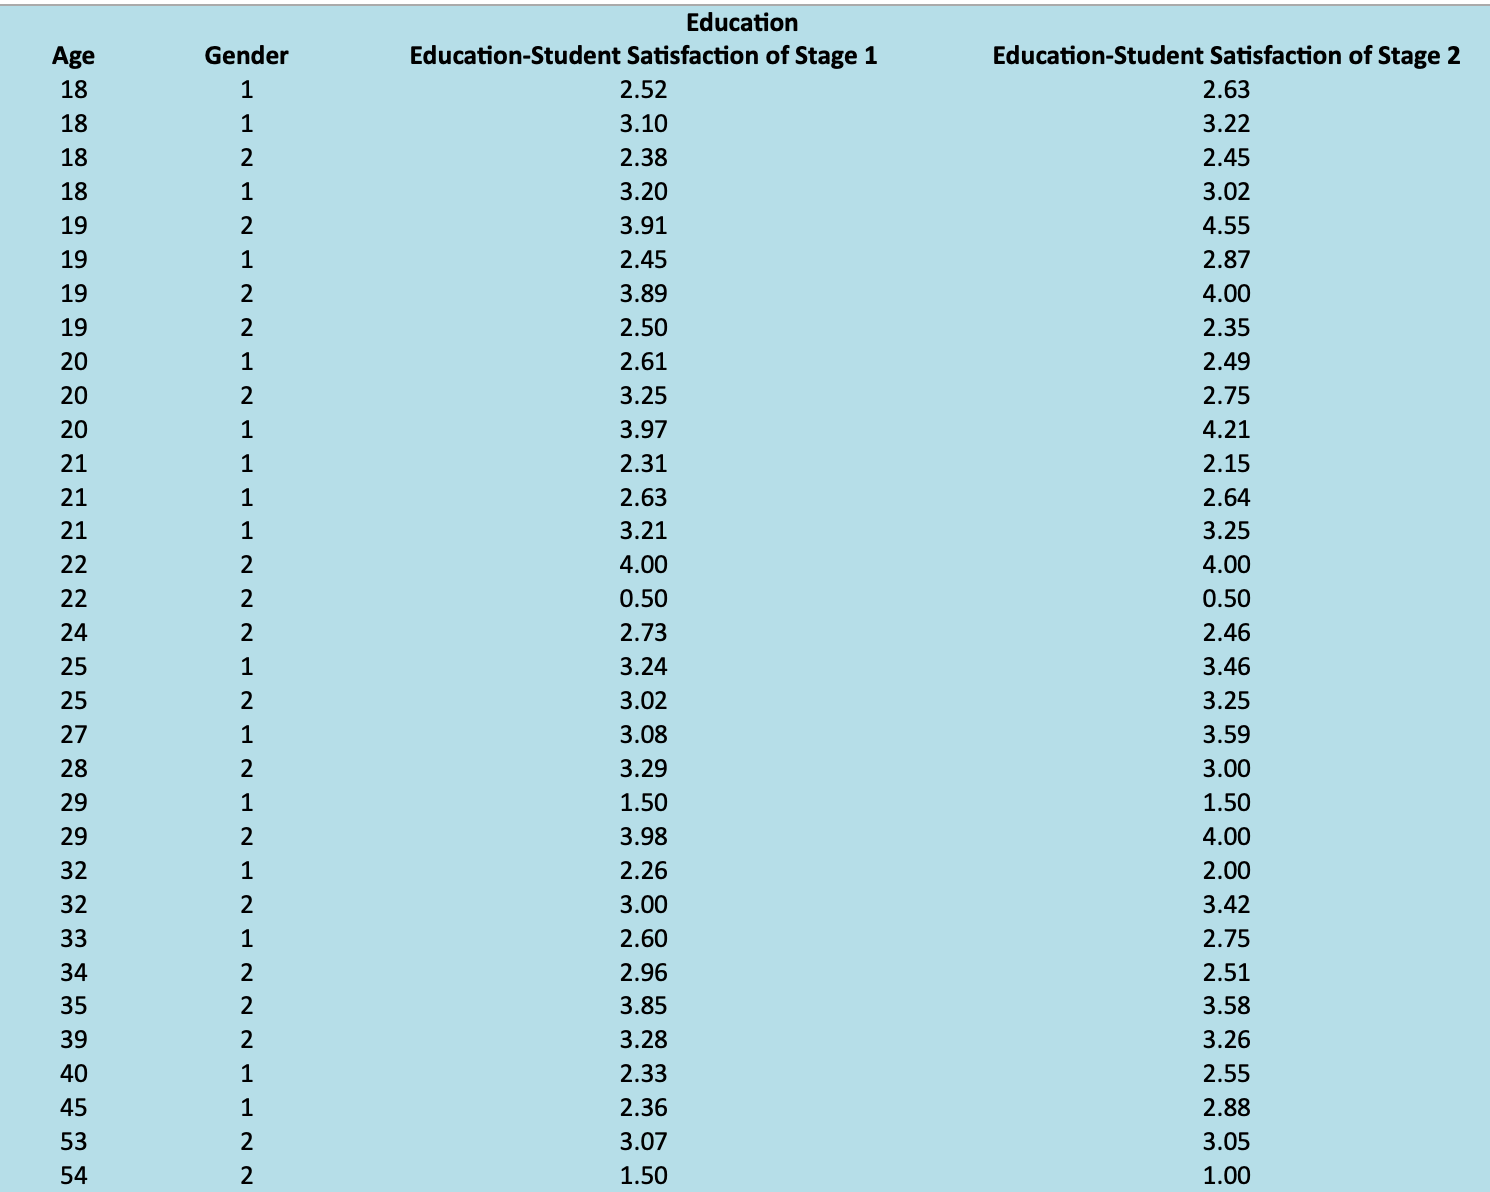
Business Age Gender Business-Student Satisfaction of Stage 1 Business- Student Satisfaction of Stage 2 18 3.02 2.83 18 3.60 3.11 19 2.88 1.87 19 3.70 3.82 4.41 4.00 2.95 2.72 4.39 4.39 3.00 2.00 3.11 2.91 3.75 2.90 4.47 4.00 2.81 2.80 3.13 2.50 3.71 3.34 4.50 4.22 1.00 0.50 H N N P N P N N P P N N P P N H N N P P P N H N NN ANNANNH 3.23 2.77 3.74 3.71 3.52 3.52 3.58 3.71 3.79 2.90 1.38 1.00 4.48 4.00 2.76 2.48 3.50 3.11 3.10 2.98 3.46 3.22 4.35 4.29 3.78 3.12 2.83 2.00 2.86 1.50 3.57 3.22 1.30 0.50Nursing Age Gender Nursing-Student Satisfaction of Stage 1 19 Nursing-Student Satisfaction of Stage 2 1.52 19 2.22 2.10 2.80 20 1.38 2.08 2.20 2.90 2.91 3.61 1.45 2.15 2.89 3.59 1.50 2.20 1.61 2.31 2.25 2.95 2.97 3.67 1.31 2.01 1.63 2.33 2.21 2.91 3.00 3.70 0.30 1.00 H H P P N N N H N P N P N N N P H H N N H N H N H NN NN HH HH 1.73 2.43 2.24 2.94 2.02 2.72 2.08 2.78 2.29 2.99 0.50 1.20 2.98 3.68 1.26 1.96 2.00 2.70 1.60 2.30 1.96 34 2.66 2.85 3.55 2.28 2.98 1.33 2.03 44 1.36 52 2.06 2.07 53 2.77 0.50 1.20Education Age Gender Education-Student Satisfaction of Stage 1 Education-Student Satisfaction of Stage 2 18 1 2.52 2.63 18 3.10 3.22 18 2.38 2.45 18 3.20 3.02 3.91 4.55 2.45 2.87 3.89 4.00 2.50 2.35 2.61 2.49 3.25 2.75 3.97 4.21 2.31 2.15 2.63 2.64 3.21 3.25 4.00 4.00 0.50 0.50 2.73 2.46 3.24 3.46 3.02 3.25 3.08 3.59 3.29 3.00 1.50 1.50 3.98 4.00 2.26 2.00 3.00 3.42 2.60 2.75 2.96 2.51 3.85 3.58 3.28 3.26 2.33 2.55 2.36 2.88 3.07 3.05 54 1.50 1.00
Step by Step Solution
There are 3 Steps involved in it

Get step-by-step solutions from verified subject matter experts