

Question: Ece.) - X Data table (Click the icon here in order to copy the contents of the data table below into a spreadsheet.) Expected Return
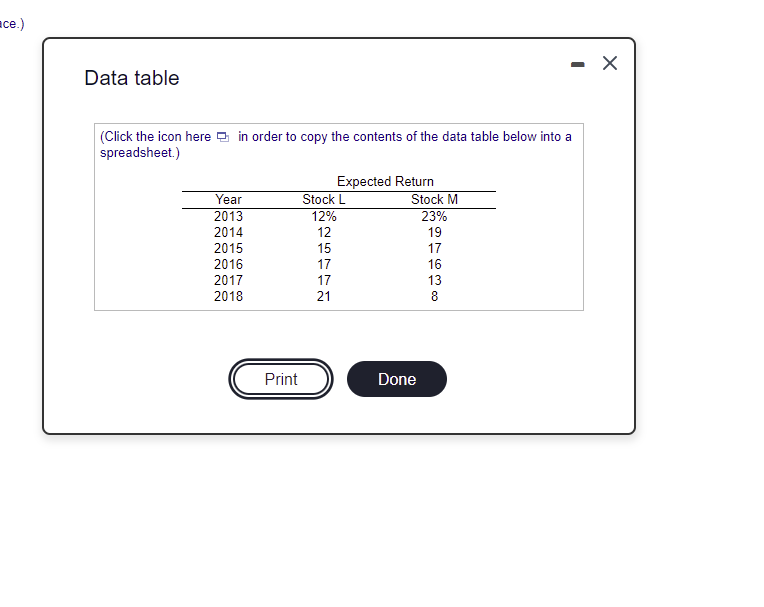
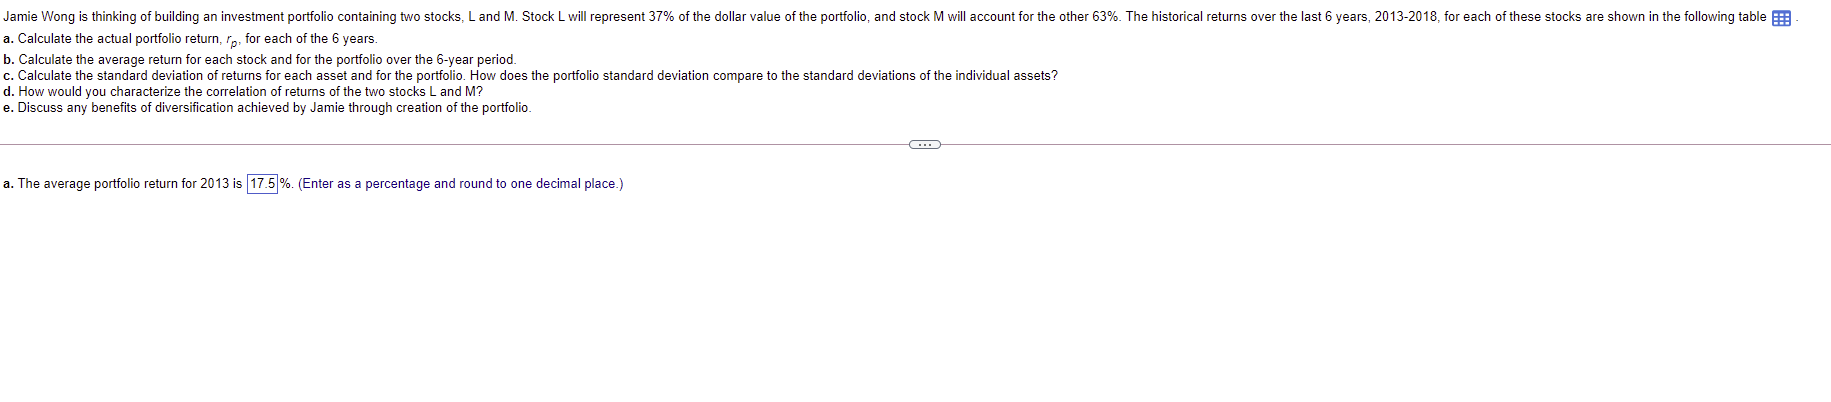
Ece.) - X Data table (Click the icon here in order to copy the contents of the data table below into a spreadsheet.) Expected Return Year Stock L Stock M 2013 12% 23% 2014 12 19 2015 15 17 2016 17 16 2017 17 13 2018 21 8 Print Done Jamie Wong is thinking of building an investment portfolio containing two stocks, Land M. Stock L will represent 37% of the dollar value of the portfolio, and stock M will account for the other 63%. The historical returns over the last 6 years, 2013-2018, for each of these stocks are shown in the following table 5 a. Calculate the actual portfolio return, lp, for each of the 6 years. b. Calculate the average return for each stock and for the portfolio over the 6-year period. c. Calculate the standard deviation of returns for each asset and for the portfolio. How does the portfolio standard deviation compare to the standard deviations of the individual assets? d. How would you characterize the correlation of returns of the two stocks L and M? e. Discuss any benefits of diversification achieved by Jamie through creation of the portfolio a. The average portfolio return for 2013 is 17.5%. (Enter as a percentage and round to one decimal place.)
Step by Step Solution
There are 3 Steps involved in it

Get step-by-step solutions from verified subject matter experts