

Question: ECON 1202 - Assignment # 1 1) Demonstrate graphically and explain a recessionary gap. Describe two solutions for closing the gap. The diagram of
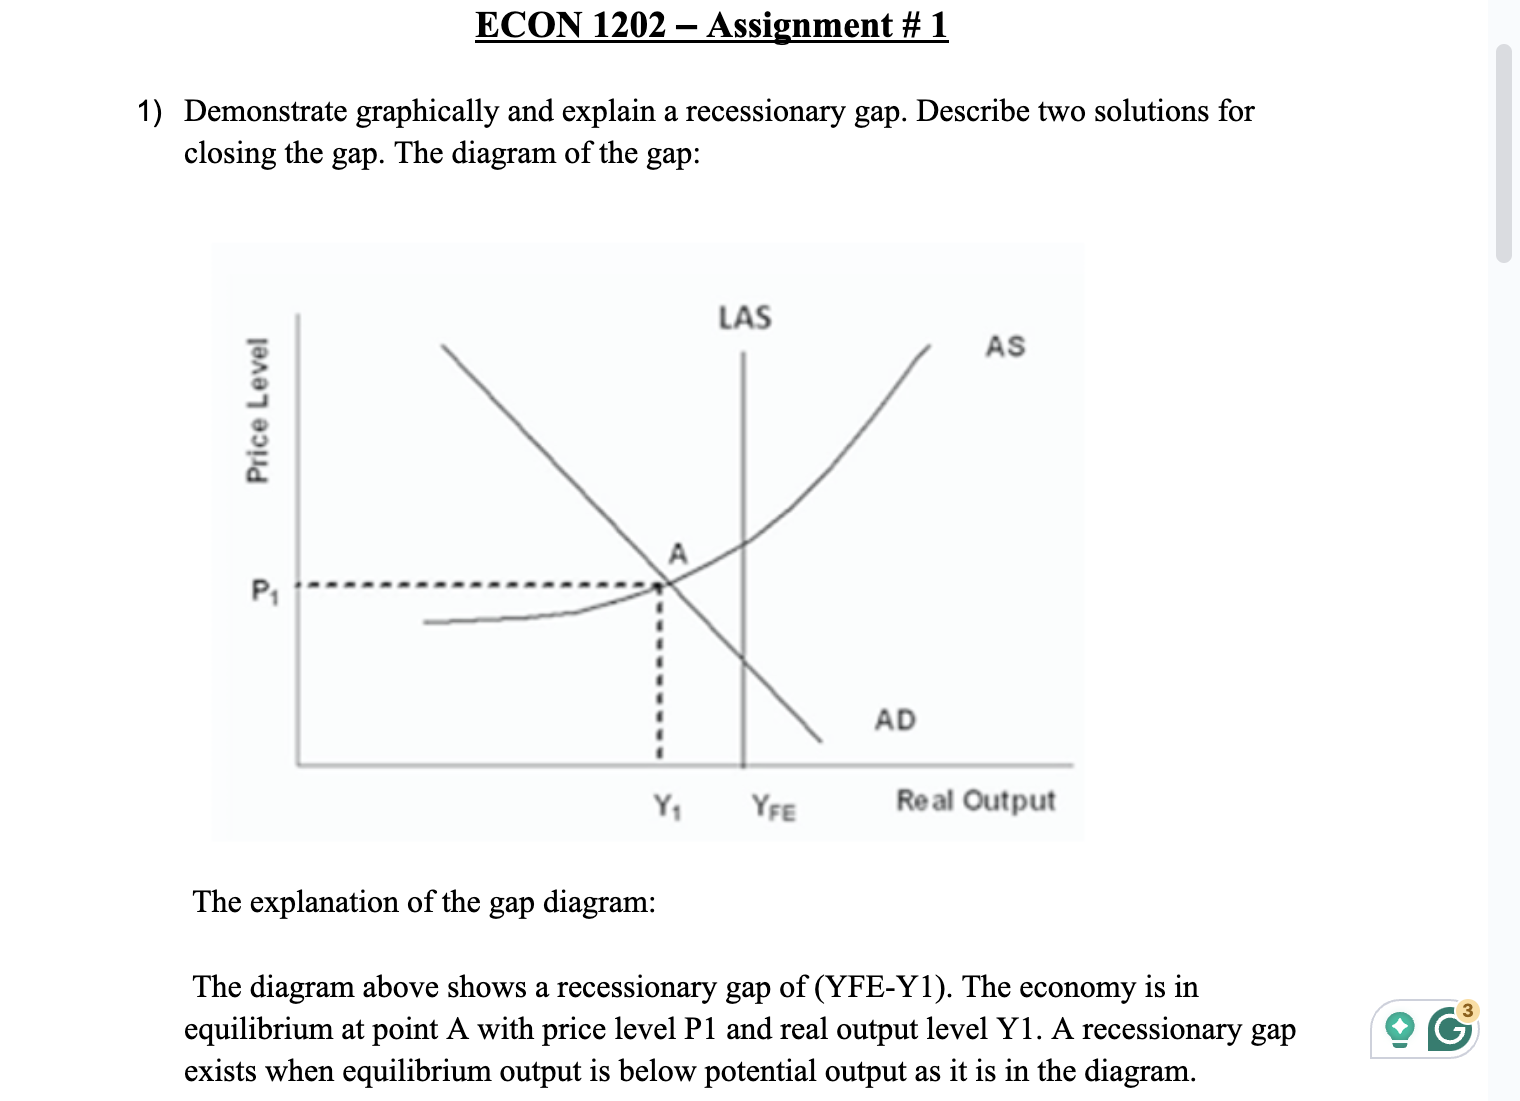
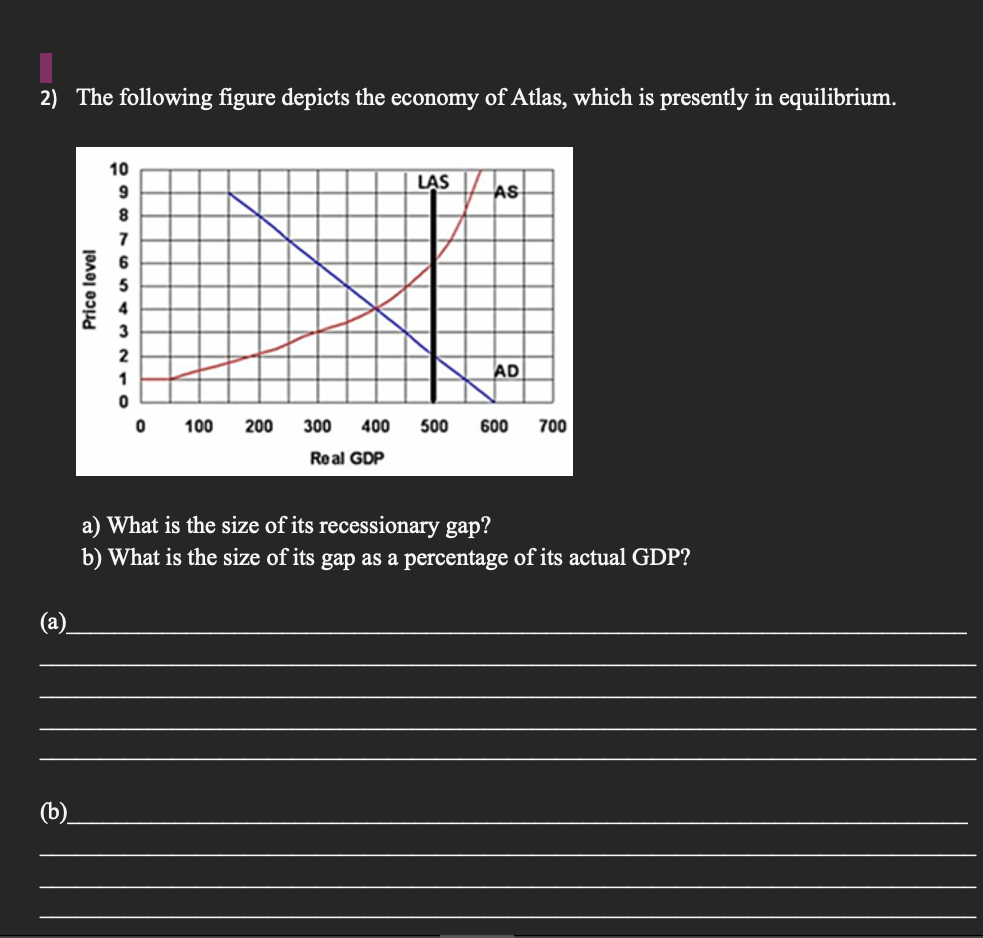
ECON 1202 - Assignment # 1 1) Demonstrate graphically and explain a recessionary gap. Describe two solutions for closing the gap. The diagram of the gap: P1 Price Level LAS AS AD Y YFE Real Output The explanation of the gap diagram: The diagram above shows a recessionary gap of (YFE-Y1). The economy is in equilibrium at point A with price level P1 and real output level Y1. A recessionary gap exists when equilibrium output is below potential output as it is in the diagram. (b)_ 2) The following figure depicts the economy of Atlas, which is presently in equilibrium. Price level 10 9 8 3 7 6 LAS AS 2 1 AD 0 0 100 200 300 400 500 600 700 Real GDP a) What is the size of its recessionary gap? b) What is the size of its gap as a percentage of its actual GDP?
Step by Step Solution
There are 3 Steps involved in it

Get step-by-step solutions from verified subject matter experts