

Question: ECON 225 Final ProjectFor this final project, you will need to work through the following 5 questions using Microsoft Excel and submit a file with
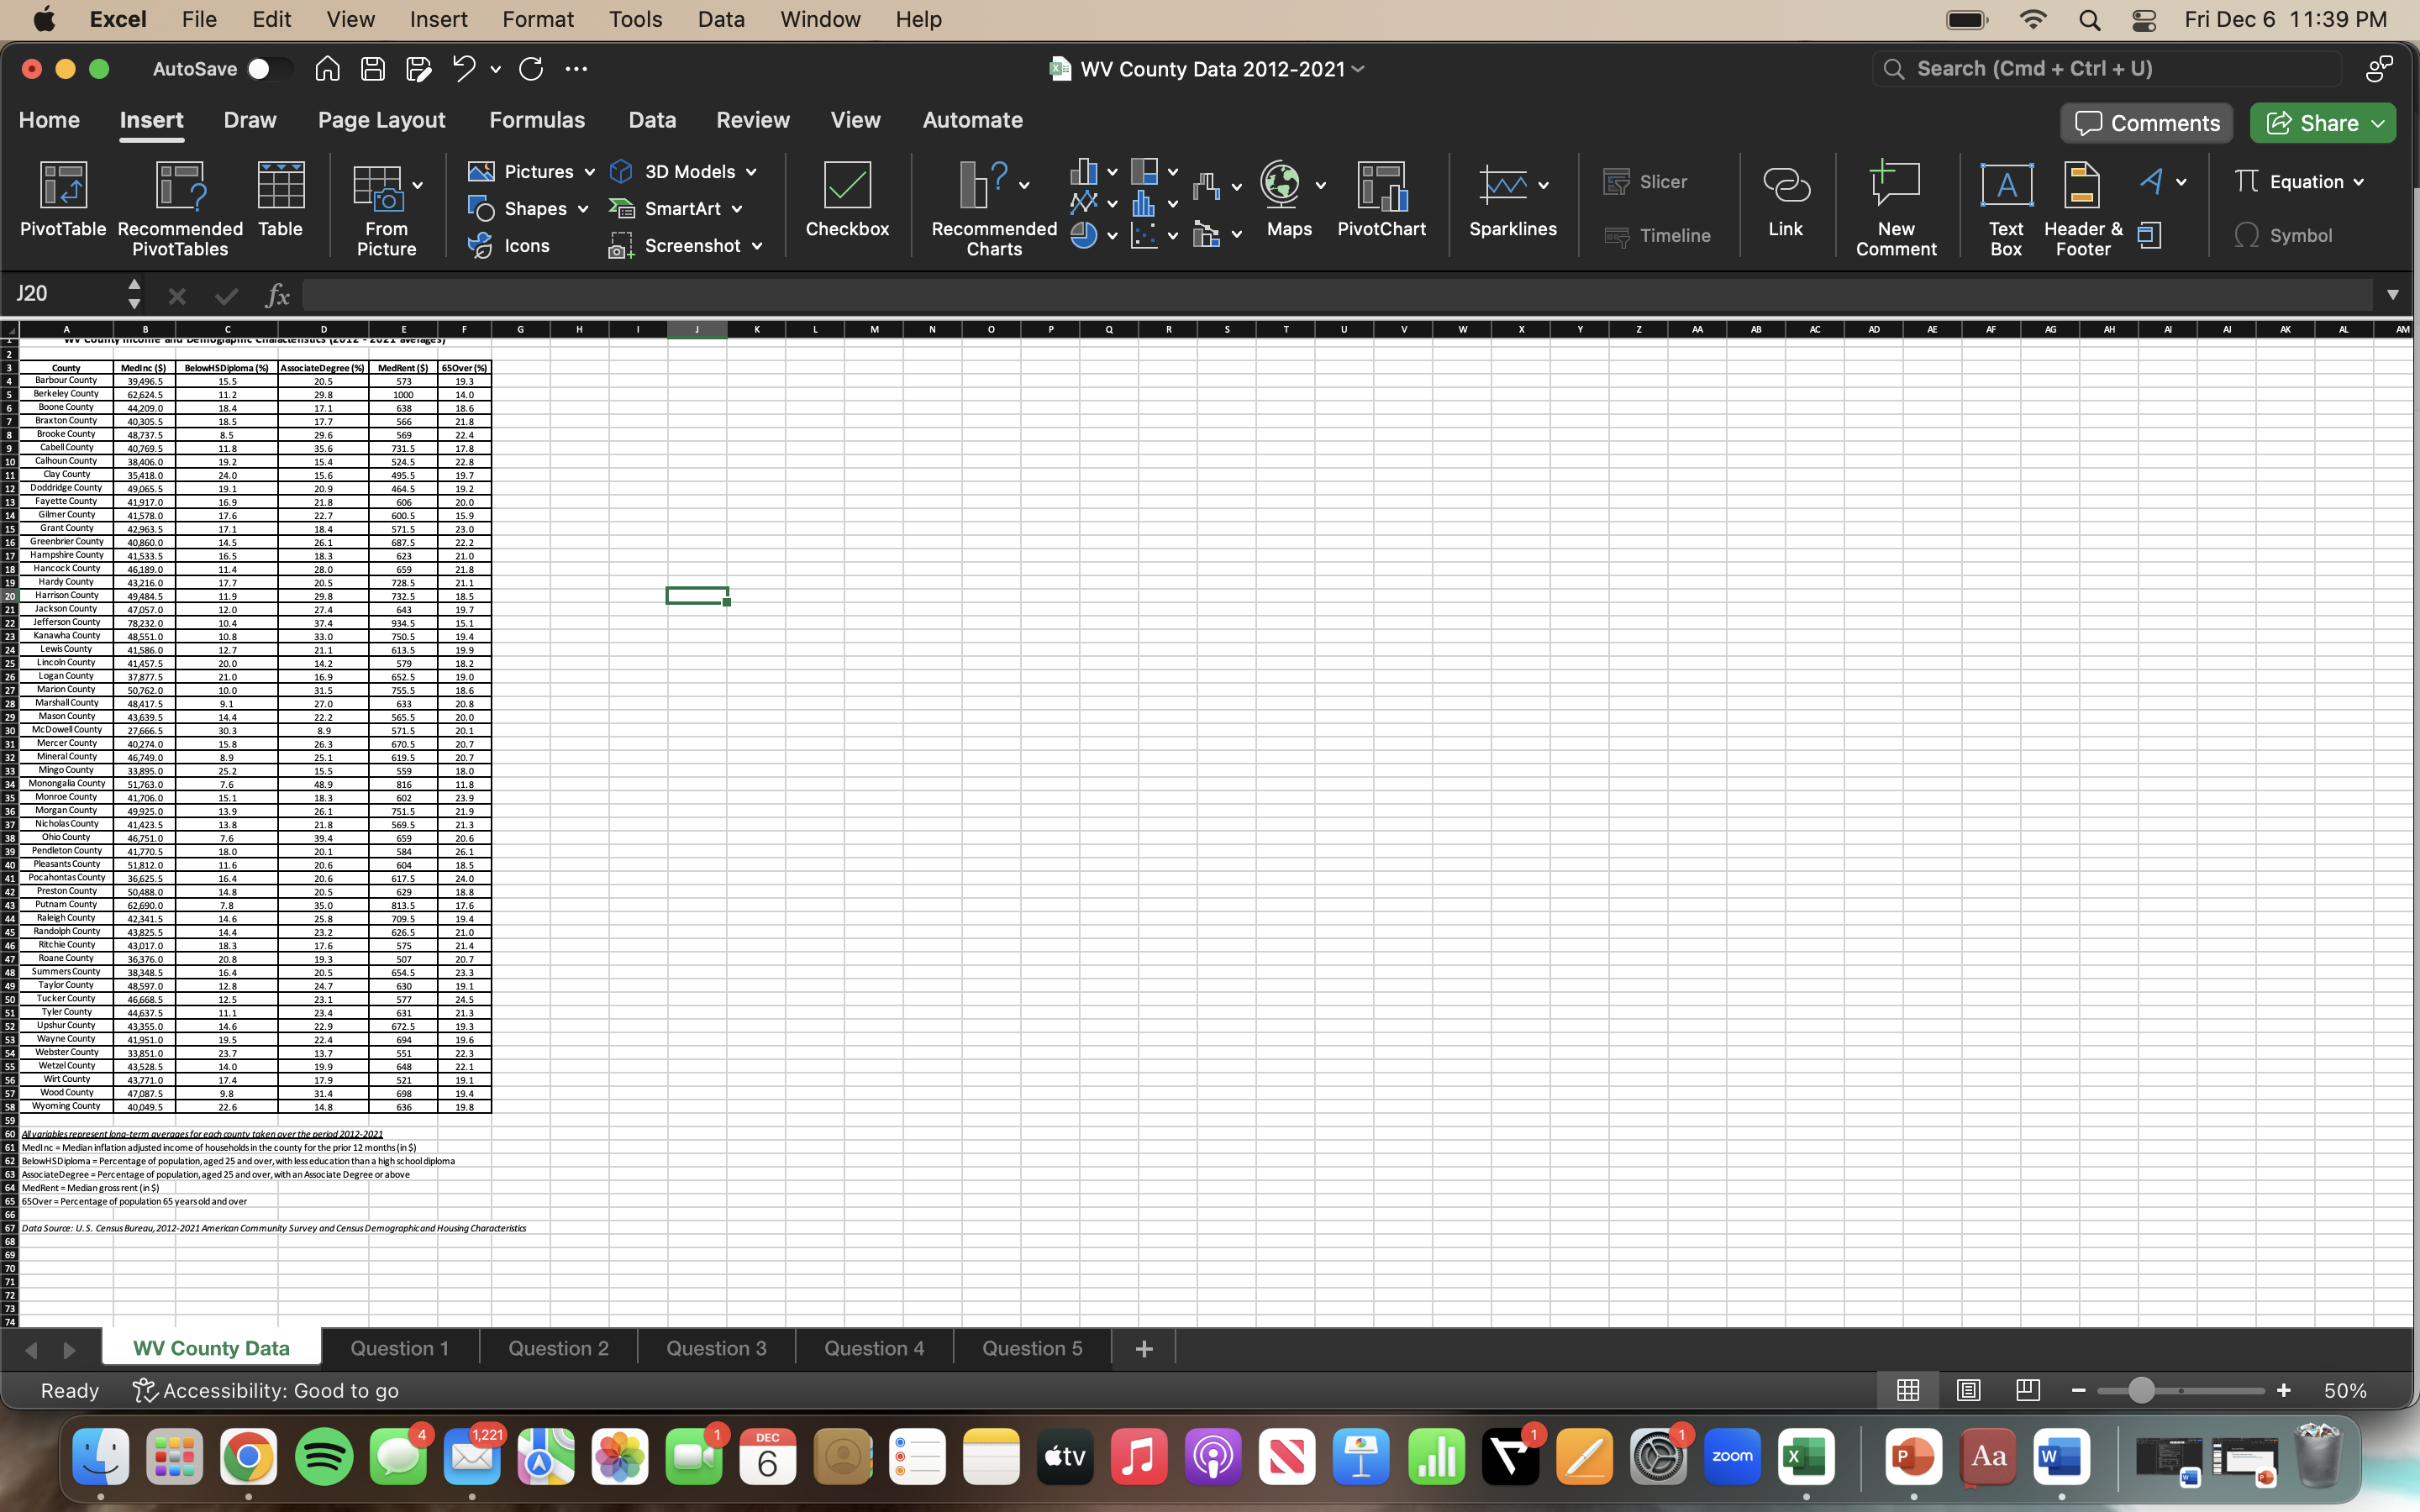
ECON 225 Final ProjectFor this final project, you will need to work through the following 5 questions using Microsoft Excel and submit a file with your responses to each individual question. Download the Excel file located in the Final Project folder called "WV County Data 2012-2021" first. There is a separate tab within the file for each question with a text box included to write the responses for each question. Please be sure to answer the questions thoroughly for maximum credit.Question 1 [5 points]You will visualize the relationship between a county's median income (MedInc) and the percent of the county's population with at least an associate's degree (AssociateDegree). One should probably expect a positive relationship between MedInc and AssociateDegree: on average, counties with a greater percent of the population with an associate's degree should have relatively more workers in higher-paying jobs and thus should have a higher median income. Click Insert, then look for the X Y (Scatter) group and click on this. A blank rectangular plotting area will appear on your sheet. Right-click on the blank area and then click Select Data. In the Series area, add a new series by clicking the "+" button. Add AssociateDegree as the x-values and MedInc as the Y values. Click OK. Paste your figure onto the sheet titled "Question 1", along with a brief discussion of the relationship between AssociateDegree and MedInc.
Step by Step Solution
There are 3 Steps involved in it

Get step-by-step solutions from verified subject matter experts