

Question: Economic GDP problem 6. Use the data in the table to construct two grouped bar graphs showing the percentage of spending for C + J-+
Economic GDP problem
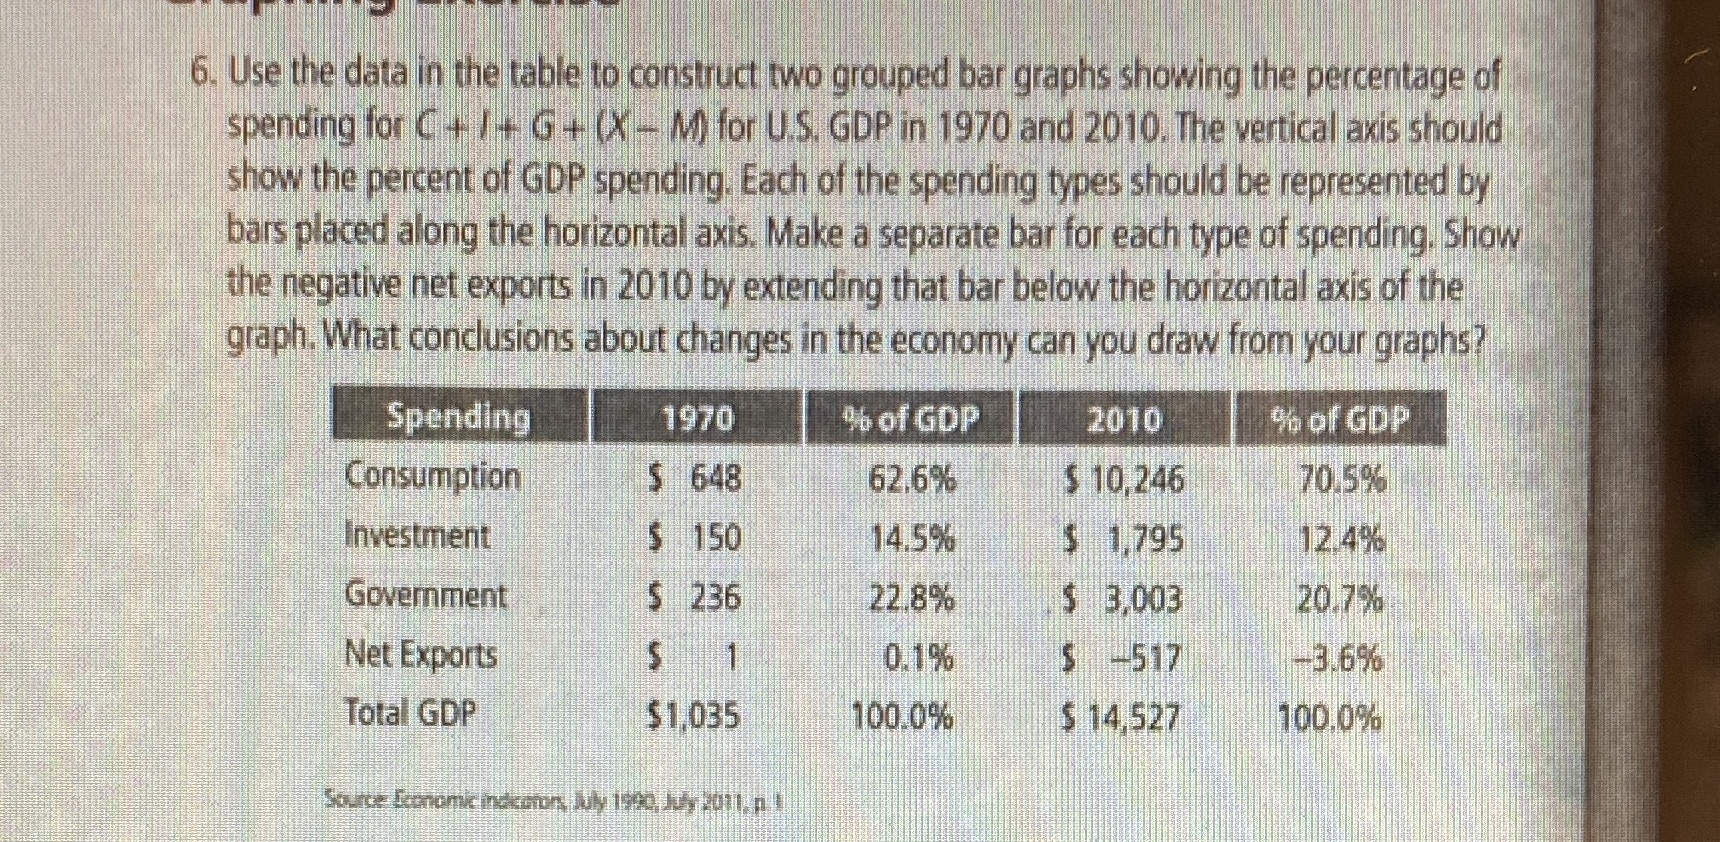
6. Use the data in the table to construct two grouped bar graphs showing the percentage of spending for C + J-+ G + (X - M) for U.S. GDP in 1970 and 2010. The vertical axis should show the percent of GDP spending. Each of the spending types should be represented by bars placed along the horizontal axis. Make a separate bar for each type of spending. Show the negative net exports in 2010 by extending that bar below the horizontal axis of the graph. What conclusions about changes in the economy can you draw from your graphs? Spending 1970 46 of GDP 2010 9% of GDP Consumption 5 648 62.6% $ 10,246 70.5% Investment $ 150 14.5% $ 1,795 12.49% Government $ 236 22.8% $ 3,003 20.7% Net Exports 0.1% 5 -517 -3.6% Total GDP $1.035 100.0% $ 14,527 100.0% Source Economic inekcoron, My 1920, JU, 2011, n 1
Step by Step Solution
There are 3 Steps involved in it

Get step-by-step solutions from verified subject matter experts