

Rapidly rising health care costs have been a prominent political issue for decades. Since at least...
Fantastic news! We've Found the answer you've been seeking!
Question:
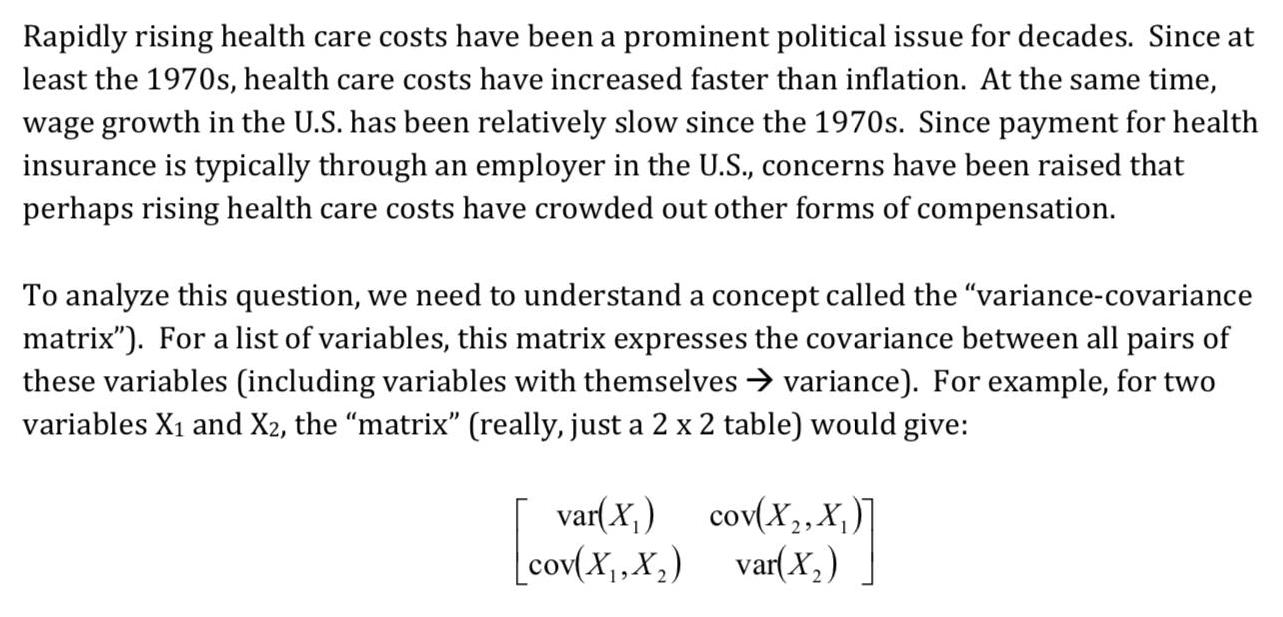
![Notice that the covariance in the upper right corner is redundant, since covariance is symmetric (cov[X1,X2] = cov[X2,X1]). S](https://dsd5zvtm8ll6.cloudfront.net/si.experts.images/questions/2022/03/6243e4ac7e16e_1648616618978.jpg)
Expert Answer:
To estimate the slope of a regression of growth in wages on growth in health care spending you can u... View the full answer

Related Book For 

Statistics for Business and Economics
ISBN: 978-0321826237
12th edition
Authors: James T. McClave, P. George Benson, Terry T Sincich
Posted Date:
