Assume that in the following figure the initial value of Resources is 10,000 units, the initial...
Fantastic news! We've Found the answer you've been seeking!
Question:
Transcribed Image Text:
Assume that in the following figure the initial value of Resources is 10,000 units, the initial value of Population is 10 people, the birth rate is 0.50 births/capita/year, and each person consumes two resources units per year. Use these values and the following figure to construct the overshoot and collapse model in STELLA. Make a graph showing the Population and Resources reservoirs over time. Run the model for 50 years. & Birth rate Births = P(t) "B Births = Population P(t) Resources R(t) Consumption Consumption = P(t)*C Deaths "Deaths = P(t) *D D=1-R(t)/Ro -X3 Death Rate Consumption Rate (a) Decrease the Birth Rate to 0.1 and rerun the model. Make sure that you run long enough for the system to stabilize. What differences do you see from the case in which the Birth Rate is 0.5? Make sure that you pay attention to the scale on the vertical axis of the graph. Can you explain why the system's behavior changes in this way? (b) Change the Birth Rate back to 0.50 and change the Consumption Rate to 20 units/person/year. Rerun the model and compare the results with the original case. Can you explain why the system's behavior changes in the ways that it does? (c) Summarize what you have learned from these experiments with the model. What conditions lead to more rapid collapse of the system? (d) Modify your original model so that the Resources can be renewed via a Renewal flow process. Assume that the Renewal inflow is proportional to the size of the Resources. Also assume that a converter called the Renewal Rate represents the proportionality constant. Set the Renewal Rate constant to be equal to 0.05. How does the behavior of this new system compare with the behavior of the original system? Can you explain why? Assume that in the following figure the initial value of Resources is 10,000 units, the initial value of Population is 10 people, the birth rate is 0.50 births/capita/year, and each person consumes two resources units per year. Use these values and the following figure to construct the overshoot and collapse model in STELLA. Make a graph showing the Population and Resources reservoirs over time. Run the model for 50 years. & Birth rate Births = P(t) "B Births = Population P(t) Resources R(t) Consumption Consumption = P(t)*C Deaths "Deaths = P(t) *D D=1-R(t)/Ro -X3 Death Rate Consumption Rate (a) Decrease the Birth Rate to 0.1 and rerun the model. Make sure that you run long enough for the system to stabilize. What differences do you see from the case in which the Birth Rate is 0.5? Make sure that you pay attention to the scale on the vertical axis of the graph. Can you explain why the system's behavior changes in this way? (b) Change the Birth Rate back to 0.50 and change the Consumption Rate to 20 units/person/year. Rerun the model and compare the results with the original case. Can you explain why the system's behavior changes in the ways that it does? (c) Summarize what you have learned from these experiments with the model. What conditions lead to more rapid collapse of the system? (d) Modify your original model so that the Resources can be renewed via a Renewal flow process. Assume that the Renewal inflow is proportional to the size of the Resources. Also assume that a converter called the Renewal Rate represents the proportionality constant. Set the Renewal Rate constant to be equal to 0.05. How does the behavior of this new system compare with the behavior of the original system? Can you explain why?
Expert Answer:
Answer rating: 100% (QA)
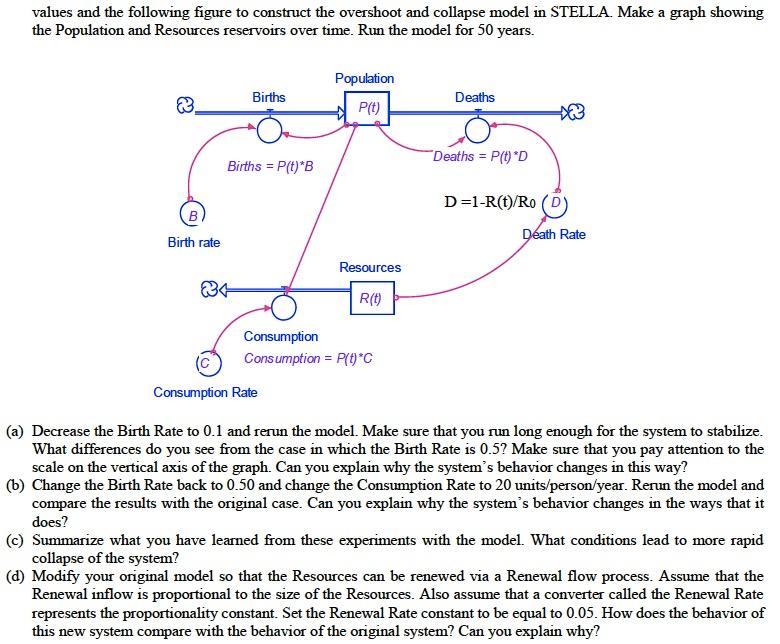
a When the birth rate is decreased to 01 the system is much slower to stabilize The graph shows that the population initially grows more slowly and th... View the full answer
Related Book For
Essentials of Business Analytics
ISBN: 978-1285187273
1st edition
Authors: Jeffrey Camm, James Cochran, Michael Fry, Jeffrey Ohlmann , David Anderson, Dennis Sweeney, Thomas Williams
Posted Date:
Students also viewed these mathematics questions
-
Make a graph showing how the wavelength of the most intense radiation component of blackbody radiation varies with the bodys absolute temperature. By what ratio does max change (final/initial) if the...
-
The scatter chart in the following figure was created using sample data for profits and market capitalizations from a sample of firms in the Fortune 500. a. What does this scatter chart indicate...
-
The right-circular conical tank shown in the following figure loses water out of a circular hole at its bottom. Determine a differential equation for the height of the water h at time t > 0. The...
-
What are the explanations given for slow progress towards full acceptance of ISAs?
-
Consider a small, isolated town in which a brewery faces the following inverse demand: P = 15 - 0.33Q. The brewery can produce beer at a constant marginal and average total cost of $1 per bottle. a....
-
During the year, Belyk Paving Co. had sales of $2,700,000. Cost of goods sold, administrative and selling expenses, and depreciation expenses were $1,690,000, $465,000, and $530,000, respectively. In...
-
Kronenberger Burgoyne, LLP, was a law firm with two equity partners who agreed to equal ownership as of 2009. Before 2009, Kronenberger had owned a majority interest in the firm, and when, in 2011,...
-
RiverHawk Expeditions provides guided tours in scenic mountainous areas. After the first 11 months of operations in 2015, RiverHawk has the following account balances. The following transactions...
-
A wise guy majoring in math says that he thinks your lottery is a bad deal.What other utility might you tell the wise guy he might receive that makes the lottery worth playing?
-
Cost Estimation at Global Green Books Publishing Global Green Books Publishing is continuing to produce customized eBooks as a key new product line for it as a successful printing and publishing...
-
What rule of evidence that we have studied in this course would you modify? In what way? How would your modification affect the presentation of evidence at a trial? Chose Rule 609 or Rule 603
-
ABC company purchase a Land for $400,000 and to build a $600,000 warehouse building that can use 10 years. What is the depreciation amount for each year given using a straight line depreciation...
-
The U.S. federal debt, at the time of the writing of this exercise, was $17 trillion. One way to get a sense of the enormousness of that number is to imagine how much space 17 trillion one-dollar...
-
Walter Corp.'s outstanding bonds have a 5.8% coupon, 5 years left until maturity, and are currently priced at $974.67. The firm's marginal tax rate is 31%. Walter's after-tax cost of debt is %. Round...
-
What is the revenue by quarter and month? What is the revenue by device type? What is the revenue by date? What is the revenue by merchant?
-
For Apple Inc, is the resource of top tier leadership/culture valuable to customers? why? Is it rare or scarce resource? Why? Is it costly to imitate? Why? Is it non-substitutable? Why
-
How has the United States affected past international climate change agreements? Choose all correct answers. a. They have simply ignored their obligations. b. They pulled out of both agreements. c....
-
Write an essay describing the differing approaches of nursing leaders and managers to issues in practice. To complete this assignment, do the following: 1. Select an issue from the following list:...
-
The following time series shows the sales of a particular product over the past 12 months. a. Construct a time series plot. What type of pattern exists in the data? b. Use a = 0.3 to compute the...
-
The file FdiCBankFailures contains data on failures of federally insured banks between 2000 and 2012. Create a PivotTable in Excel to answer the following questions. The Pivot- Table should group the...
-
The U.S. Department of Energy's Fuel Economy Guide provides fuel efficiency data for cars and trucks. A portion of the data for 311 compact, midsized, and large cars follows. The Class column...
-
Key in project scheduling for a search of the Web. Hundreds of thousands of hits are generated from such a search. Examine a cross section of the hits. What are some of the common themes found on...
-
Go to www.infogoal.com/pmc/pmcart.htm and examine some of the archived articles and white papers on project planning and scheduling. Select one article and synthesize the main points. What are the...
-
Suppose a project plan had three distinct paths through the network. The first path consisted of activities A (3 days), B (4 days), and C (2 days). The second path consisted of activities D (4 days),...
Study smarter with the SolutionInn App