

PLEASE SOLVE ONLY QE and QF Part B NON-LINEAR/EXTREMUM Total for Part A: 35% A London-based
Question:
PLEASE SOLVE ONLY QE and QF
Part B – NON-LINEAR/EXTREMUM
Total for Part A: 35%
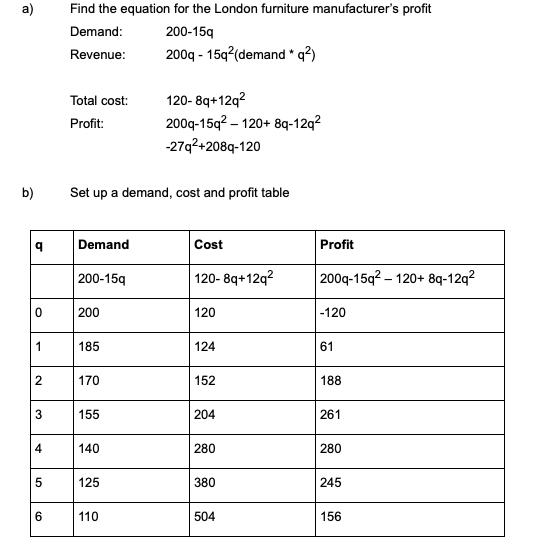
A London-based furniture maker produces a quantity (q) of 6 units of cabinets per week. The costs of the furniture maker are highlighted by the following equations:
Company's total fixed cost (FC) = £120
Total variable cost (VC) = -8q + 12q2
Demand for the units: 200 - 15q
Required:
(a) Find the equation for the London furniture maker’s profit (3 marks)
(b) Set up a demand, cost and profit table using values across the range of ‘q’ for q =
0,1, 2, 3, 4, 5, 6.
(5 marks)
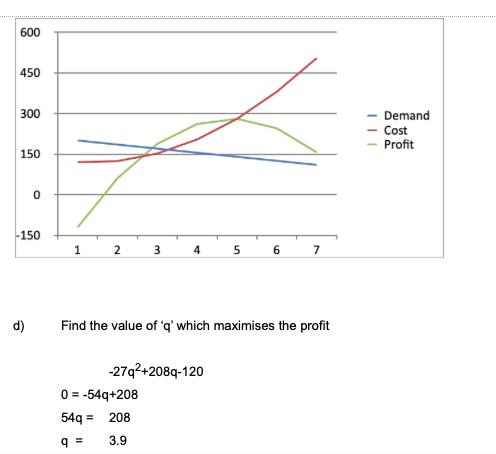
(c) Use the values from the table as coordinates in order to draw a demand, cost and profit graph. Explain what is happening with your 3 graphs.
(12 marks)
(d) From your graph, differentiate your profit equation to find the value of ‘q’ which maximises the profit.
(5 marks)
The London furniture maker has a sister company in the Liverpool with the following profit equation:
Profit = TR – TC = (200q -5q2) – (150 – 25q + Xq2)
Where X is unknown and q (Liverpool) = 7
(e) Find the value for ‘X’ coefficient based on q (Liverpool). (5 marks)
(f) Discuss the strong and weak points in the London and Liverpool models that are identified by sensitivity analysis. For example, suppose the q for London and/or
Liverpool Company was 3 units less (or 1 unit more). What would be the effects on the demand, cost and profit graphs?
Also, provide any other information that would enable the London and Liverpool branches to become more competitive in the furniture manufacturing markets.
PLEASE SOLVE ONLY QE and QF
Expert Answer:
Solving only e and f as asked by the student e II200q5q15025q Xq To maximise profit by choosing q q ... View the full answer


Managerial Decision Modeling with Spreadsheets
ISBN: 978-0136115830
3rd edition
Authors: Nagraj Balakrishnan, Barry Render, Jr. Ralph M. Stair
