

Question: ed Save Part B Calculation Question (52 marks) Sh I necessary steps in your answers. No marks will be awarded if there are no written
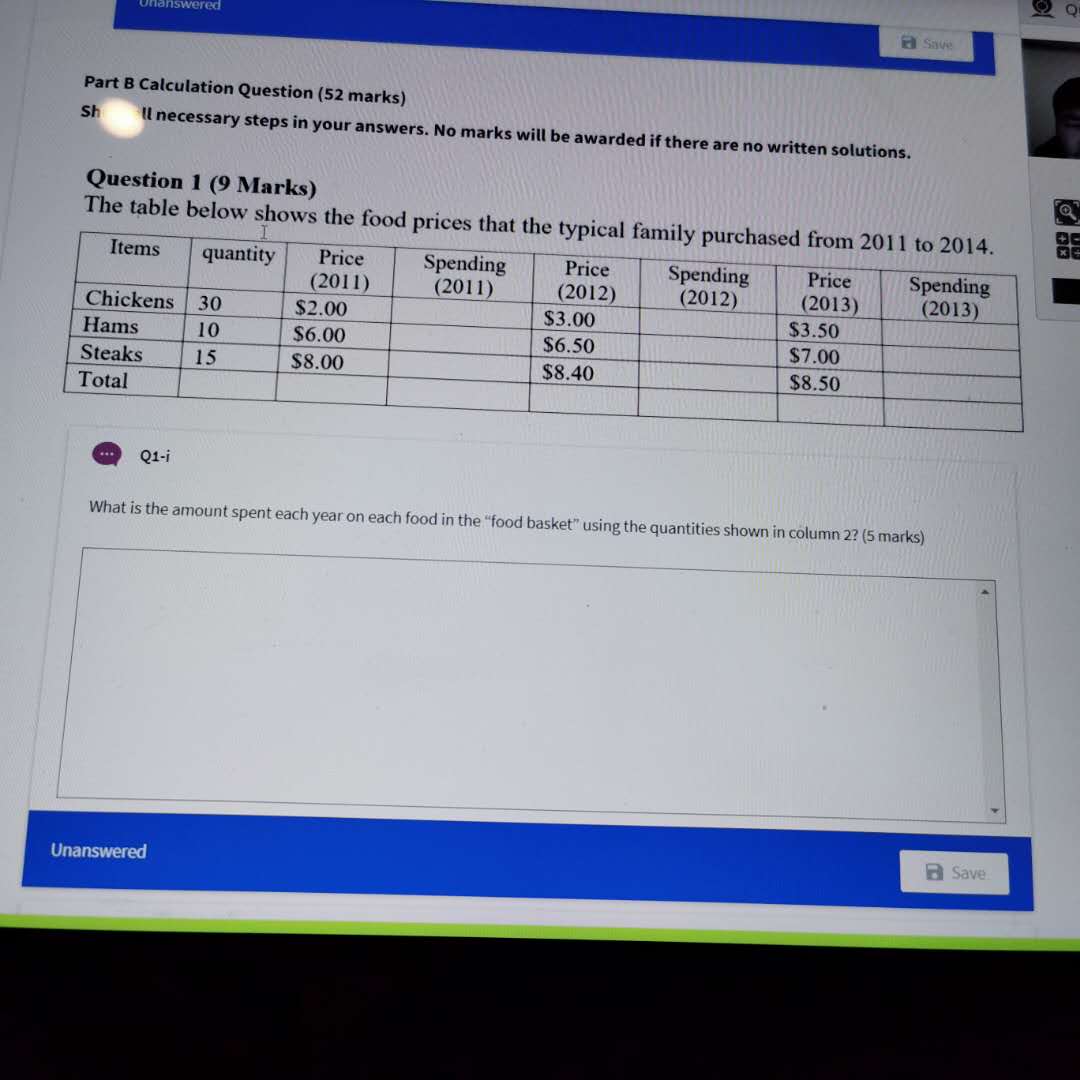
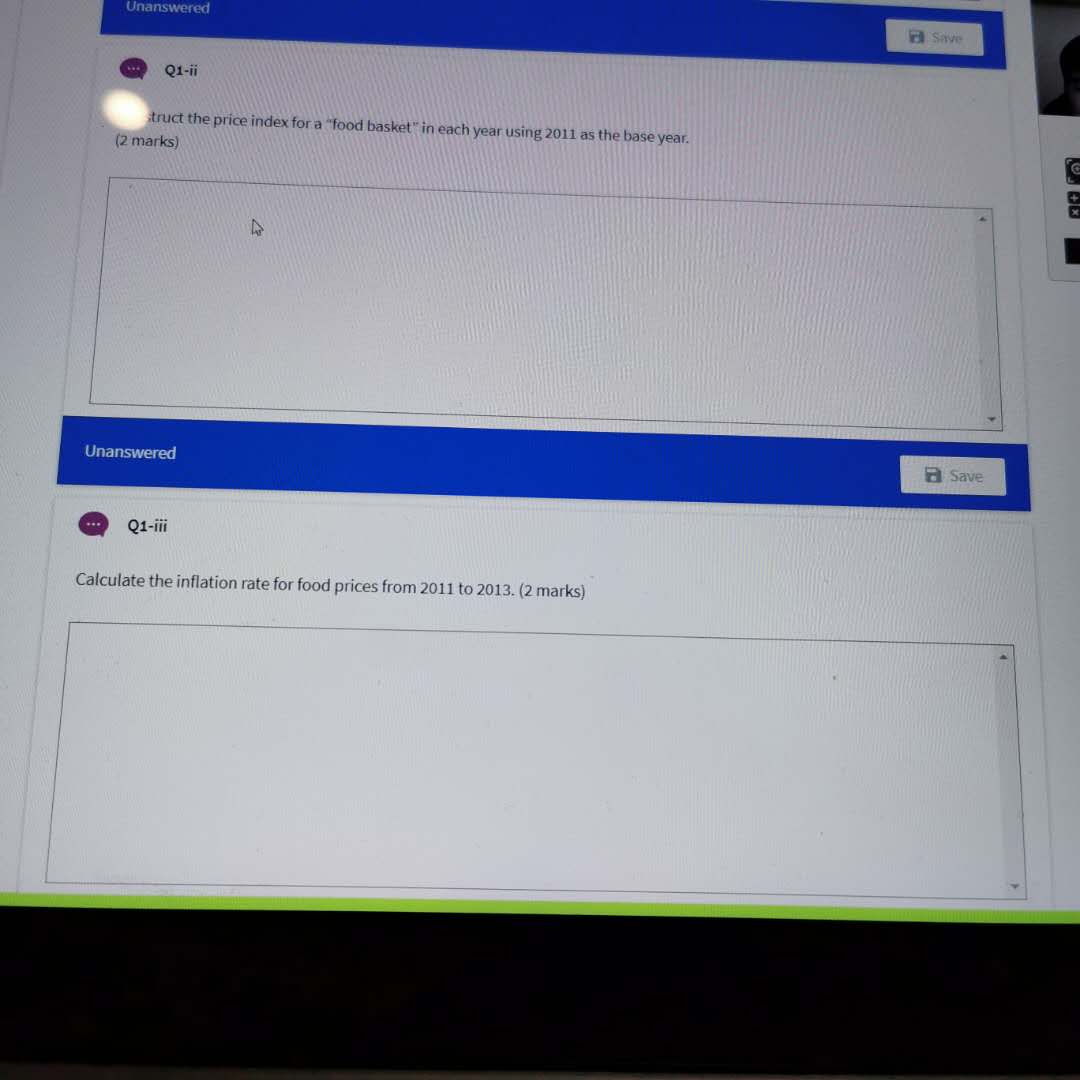
ed Save Part B Calculation Question (52 marks) Sh I necessary steps in your answers. No marks will be awarded if there are no written solutions. Question 1 (9 Marks) The table below shows the food prices that the typical family purchased from 2011 to 2014. Items quantity Price (2011) Spending Price Spending Price (2011) (2012) (2012) Spending (2013) (2013) Chickens 30 $2.00 $3.00 $3.50 Hams 10 $6.00 $6.50 $7.00 Steaks 15 $8.00 $8.40 $8.50 Total Q1-i What is the amount spent each year on each food in the "food basket" using the quantities shown in column 2? (5 marks) Unanswered SaveUnanswered Save Q1-ii struct the price index for a "food basket" in each year using 2011 as the base year. (2 marks) Unanswered Save Q1-iii Calculate the inflation rate for food prices from 2011 to 2013. (2 marks)
Step by Step Solution
There are 3 Steps involved in it

Get step-by-step solutions from verified subject matter experts