

Question: Ed The side-by-side boxplots below display the delivery time distributions {in minutes) of two pizza shops Big Slice and City Pizza I | I I
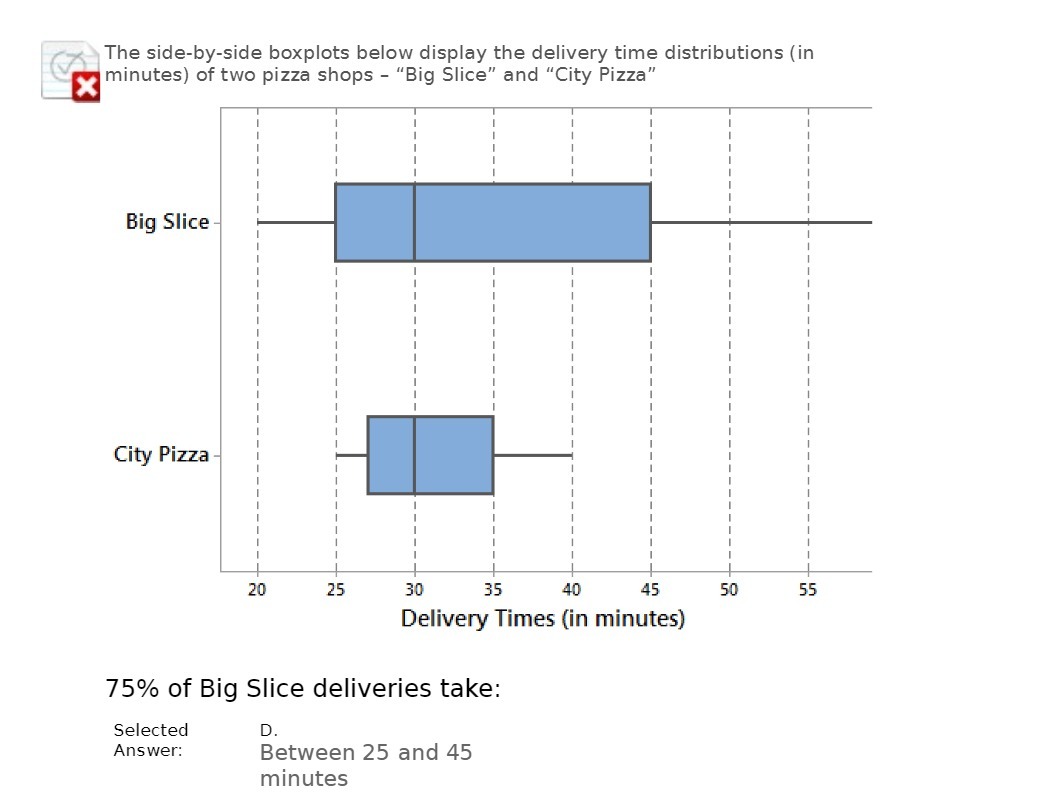
Ed The side-by-side boxplots below display the delivery time distributions {in minutes) of two pizza shops "Big Slice" and \"City Pizza\" I | I I | I I | l | I I | I I | I | I I | I I | I | I I | I I | I | I I | I I I I I | I I | ' . I I I Big Slice I I I I I | I I | I I I I I | I I I I I | I I I I I | I I I I I | I I I I I | I I I I I | I 1 I I I I | I I I I I | I I I I I | I I I I I | I I I I I | I I I I I | I I I | I I I | City Pizza i i i i I I I | I I I | I I I I I | I I I I I | I I I I I | I I I I I | I I I I I | 20 .25 30 35 4D 45 50 55 Delivery Times (in minutes) 75% of Big Slice deliveries take: Selected D. Answer: Between 25 and 45 minutes
Step by Step Solution
There are 3 Steps involved in it

Get step-by-step solutions from verified subject matter experts