

Question: edededededededededededede QUESTION 1 Fill in the blanks in the chart below: Year Years since 1960 Millions of tons of plastic discarded in the United States
edededededededededededede
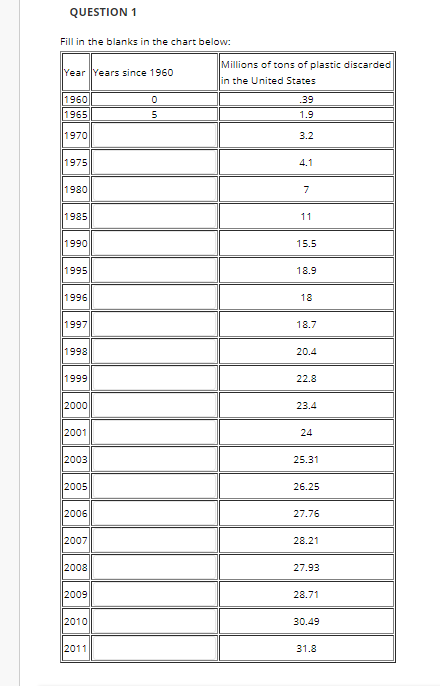
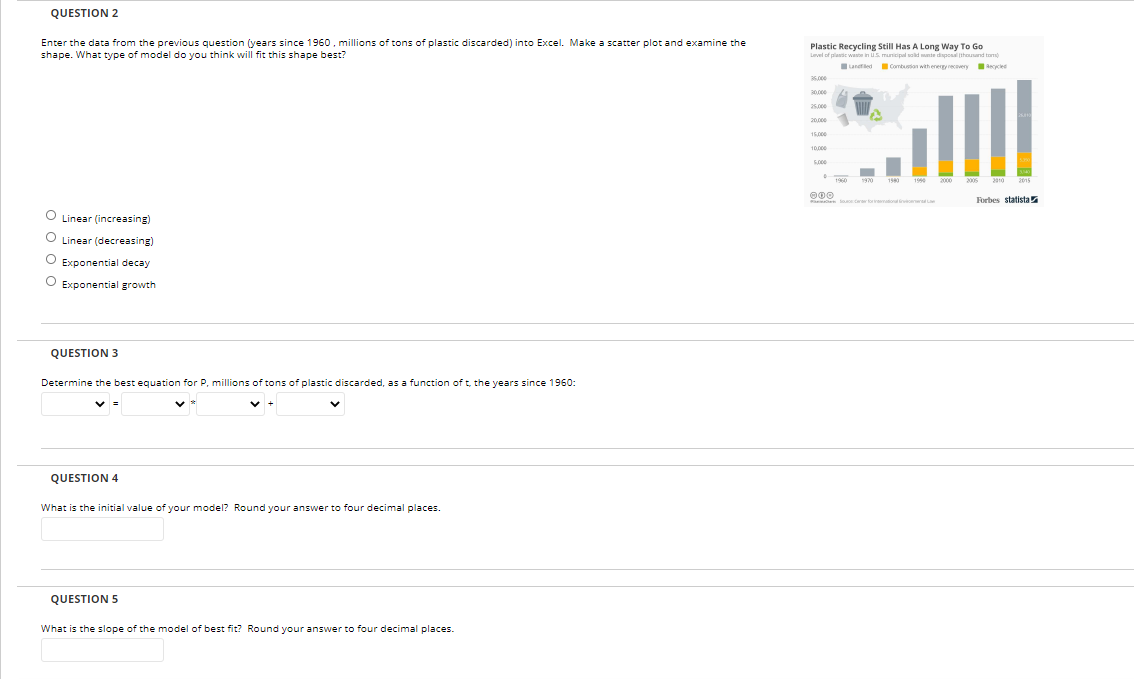
QUESTION 1 Fill in the blanks in the chart below: Year Years since 1960 Millions of tons of plastic discarded in the United States 1960 39 1965 1.9 1970 3.2 1975 4.1 1980 7 1985 11 1990 15.5 1995 18.9 1996 18 1997 18.7 1998 20.4 1999 22.8 2000 23.4 2001 24 2003 25.31 2005 26.25 2006 27.76 2007 28.21 2008 27.93 2009 28.71 2010 30.49 2011 31.8QUESTION 2 Enter the data from the previous question (years since 1960 , millions of cons of plastic discarded) into Excel. Make a scatter plot and examine the shape. What type of model do you think will fit this shape best? Plastic Recycling Still Has A Long Way To Go Level of plande waste in U.S. municipal solid mani poul [thearwind trang 1970 1589 2006 2005 000 Forbes statista 5 Linear (increasing) Linear (decreasing) Exponential decay Exponential growth QUESTION 3 Determine the best equation for P, millions of tons of plastic discarded, as a function of t, the years since 1960: QUESTION 4 What is the initial value of your model? Round your answer to four decimal places. QUESTION 5 What is the slope of the model of best fit? Round your answer to four decimal places
Step by Step Solution
There are 3 Steps involved in it

Get step-by-step solutions from verified subject matter experts