

Question: Edit Delete How would a Pro Forma Income statement look using this information (common size in percentage) Annual Data 1 Millions of US $ except
Edit Delete How would a Pro Forma Income statement look using this information (common size in percentage)
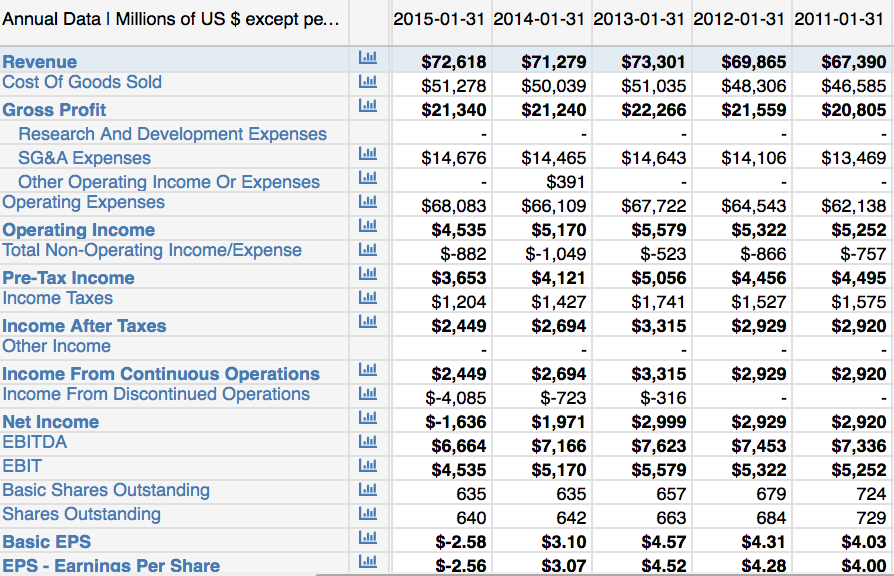
Annual Data 1 Millions of US $ except pe... 2015-01-31 2014-01-31 2013-01-31 2012-01-31 2011-01-31 $72,618 $51,278 $21,340 $71,279 $50,039 $21,240 $73,301 $51,035 $22,266 $69,865 $48,306 $21,559 $67,390 $46,585 $20,805 $14,676 $14,643 $14,106 $13,469 Revenue Cost Of Goods Sold Gross Profit Research And Development Expenses SG&A Expenses Other Operating Income Or Expenses Operating Expenses Operating Income Total Non-Operating Income/Expense Pre-Tax Income Income Taxes Income After Taxes Other Income Income From Continuous Operations Income From Discontinued Operations Net Income EBITDA EBIT Basic Shares Outstanding Shares Outstanding Basic EPS EPS - Earninas Per Share EEE EEEEEEEE $68,083 $4,535 $-882 $3,653 $1,204 $2,449 $14,465 $391 $66,109 $5,170 $-1,049 $4,121 $1,427 $2,694 $67,722 $5,579 $-523 $5,056 $1,741 $3,315 $64,543 $5,322 $-866 $4,456 $1,527 $2,929 $62,138 $5,252 $-757 $4,495 $1,575 $2,920 $2,929 $2,920 | lil | lil |clil $2,449 $-4,085 $-1,636 $6,664 $4,535 635 640 $-2.58 $-2.56 $2,694 $-723 $1,971 $7,166 $5,170 635 642 $3.10 $3.07 $3,315 $-316 $2,999 $7,623 $5,579 657 663 $4.57 $4.52 $2,929 $7,453 $5,322 679 684 $4.31 $4.28 $2,920 $7,336 $5,252 724 729 $4.03 $4.00 | lil Annual Data 1 Millions of US $ except pe... 2015-01-31 2014-01-31 2013-01-31 2012-01-31 2011-01-31 $72,618 $51,278 $21,340 $71,279 $50,039 $21,240 $73,301 $51,035 $22,266 $69,865 $48,306 $21,559 $67,390 $46,585 $20,805 $14,676 $14,643 $14,106 $13,469 Revenue Cost Of Goods Sold Gross Profit Research And Development Expenses SG&A Expenses Other Operating Income Or Expenses Operating Expenses Operating Income Total Non-Operating Income/Expense Pre-Tax Income Income Taxes Income After Taxes Other Income Income From Continuous Operations Income From Discontinued Operations Net Income EBITDA EBIT Basic Shares Outstanding Shares Outstanding Basic EPS EPS - Earninas Per Share EEE EEEEEEEE $68,083 $4,535 $-882 $3,653 $1,204 $2,449 $14,465 $391 $66,109 $5,170 $-1,049 $4,121 $1,427 $2,694 $67,722 $5,579 $-523 $5,056 $1,741 $3,315 $64,543 $5,322 $-866 $4,456 $1,527 $2,929 $62,138 $5,252 $-757 $4,495 $1,575 $2,920 $2,929 $2,920 | lil | lil |clil $2,449 $-4,085 $-1,636 $6,664 $4,535 635 640 $-2.58 $-2.56 $2,694 $-723 $1,971 $7,166 $5,170 635 642 $3.10 $3.07 $3,315 $-316 $2,999 $7,623 $5,579 657 663 $4.57 $4.52 $2,929 $7,453 $5,322 679 684 $4.31 $4.28 $2,920 $7,336 $5,252 724 729 $4.03 $4.00 | lil
Step by Step Solution
There are 3 Steps involved in it

Get step-by-step solutions from verified subject matter experts