

Question: Edit View Data Transform Insert Format Analyze Graphs Utilities Extensio Output1 [Document2] - IBM SPSS Statistics Viewer Regression Descriptive Statistics Mean Std. Deviation N
![Edit View Data Transform Insert Format Analyze Graphs Utilities Extensio Output1 [Document2]](https://s3.amazonaws.com/si.experts.images/answers/2024/05/6647d443e0867_4276647d4438ac3f.jpg)
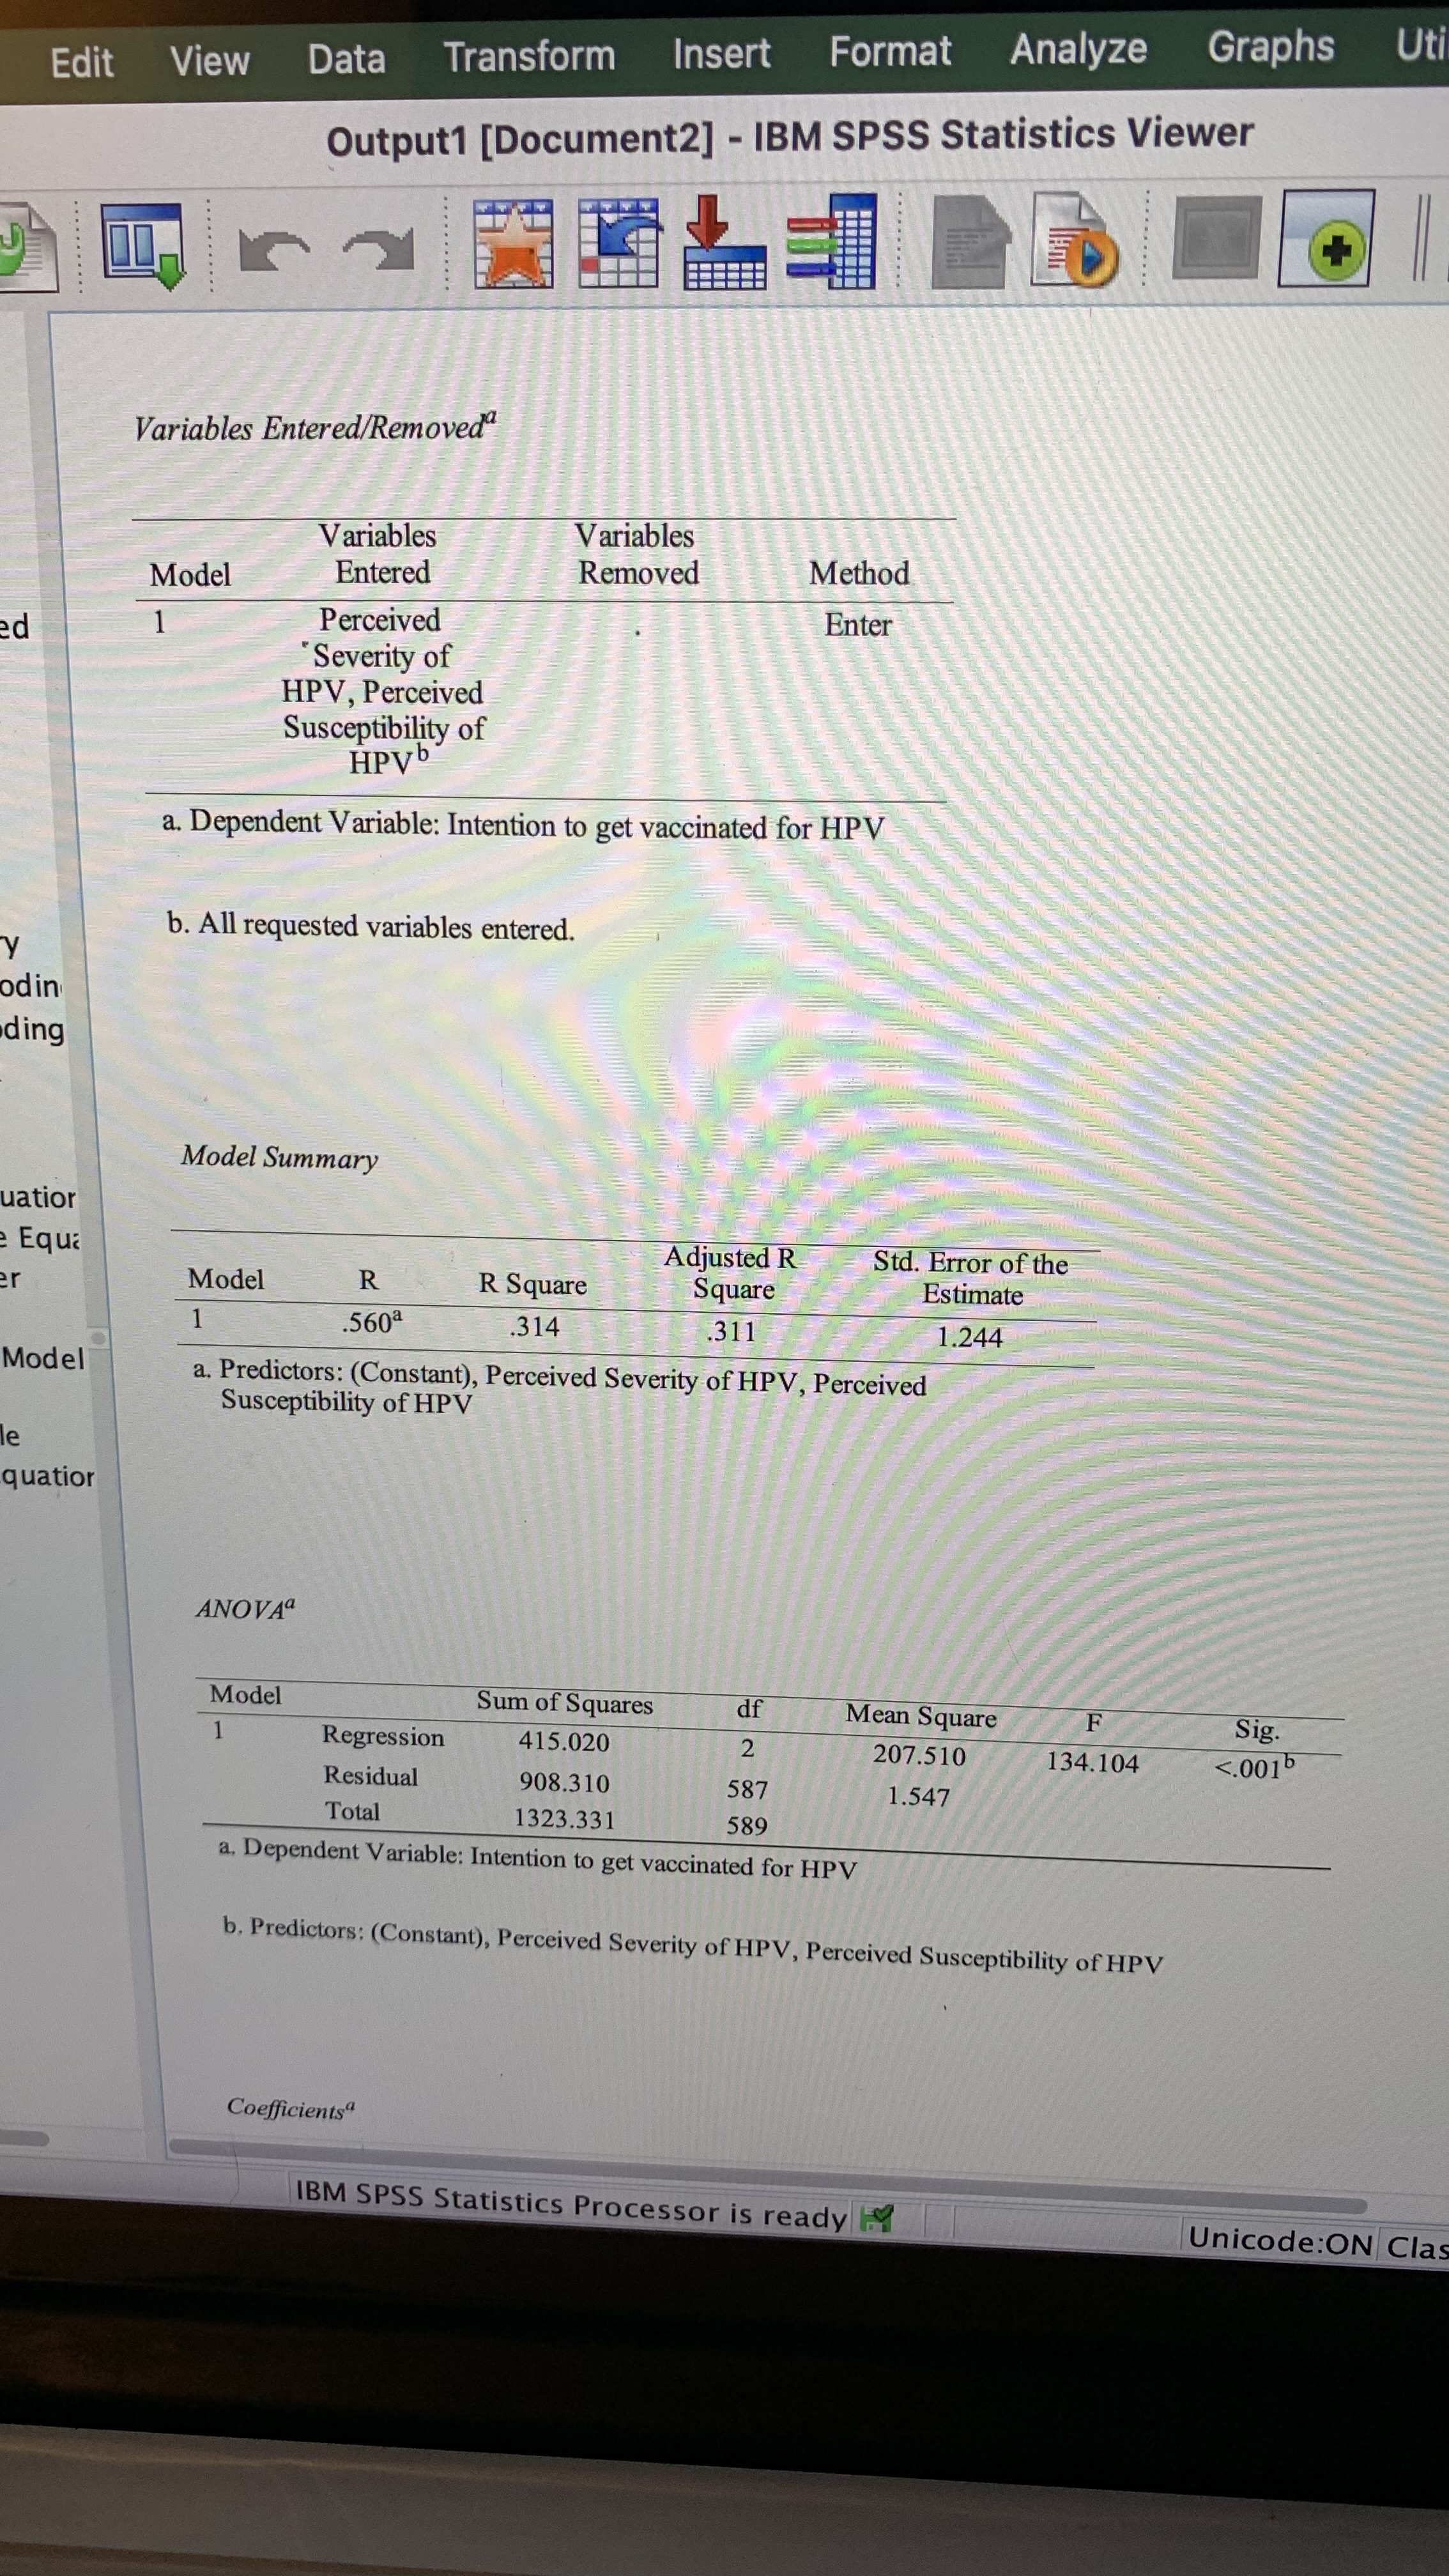
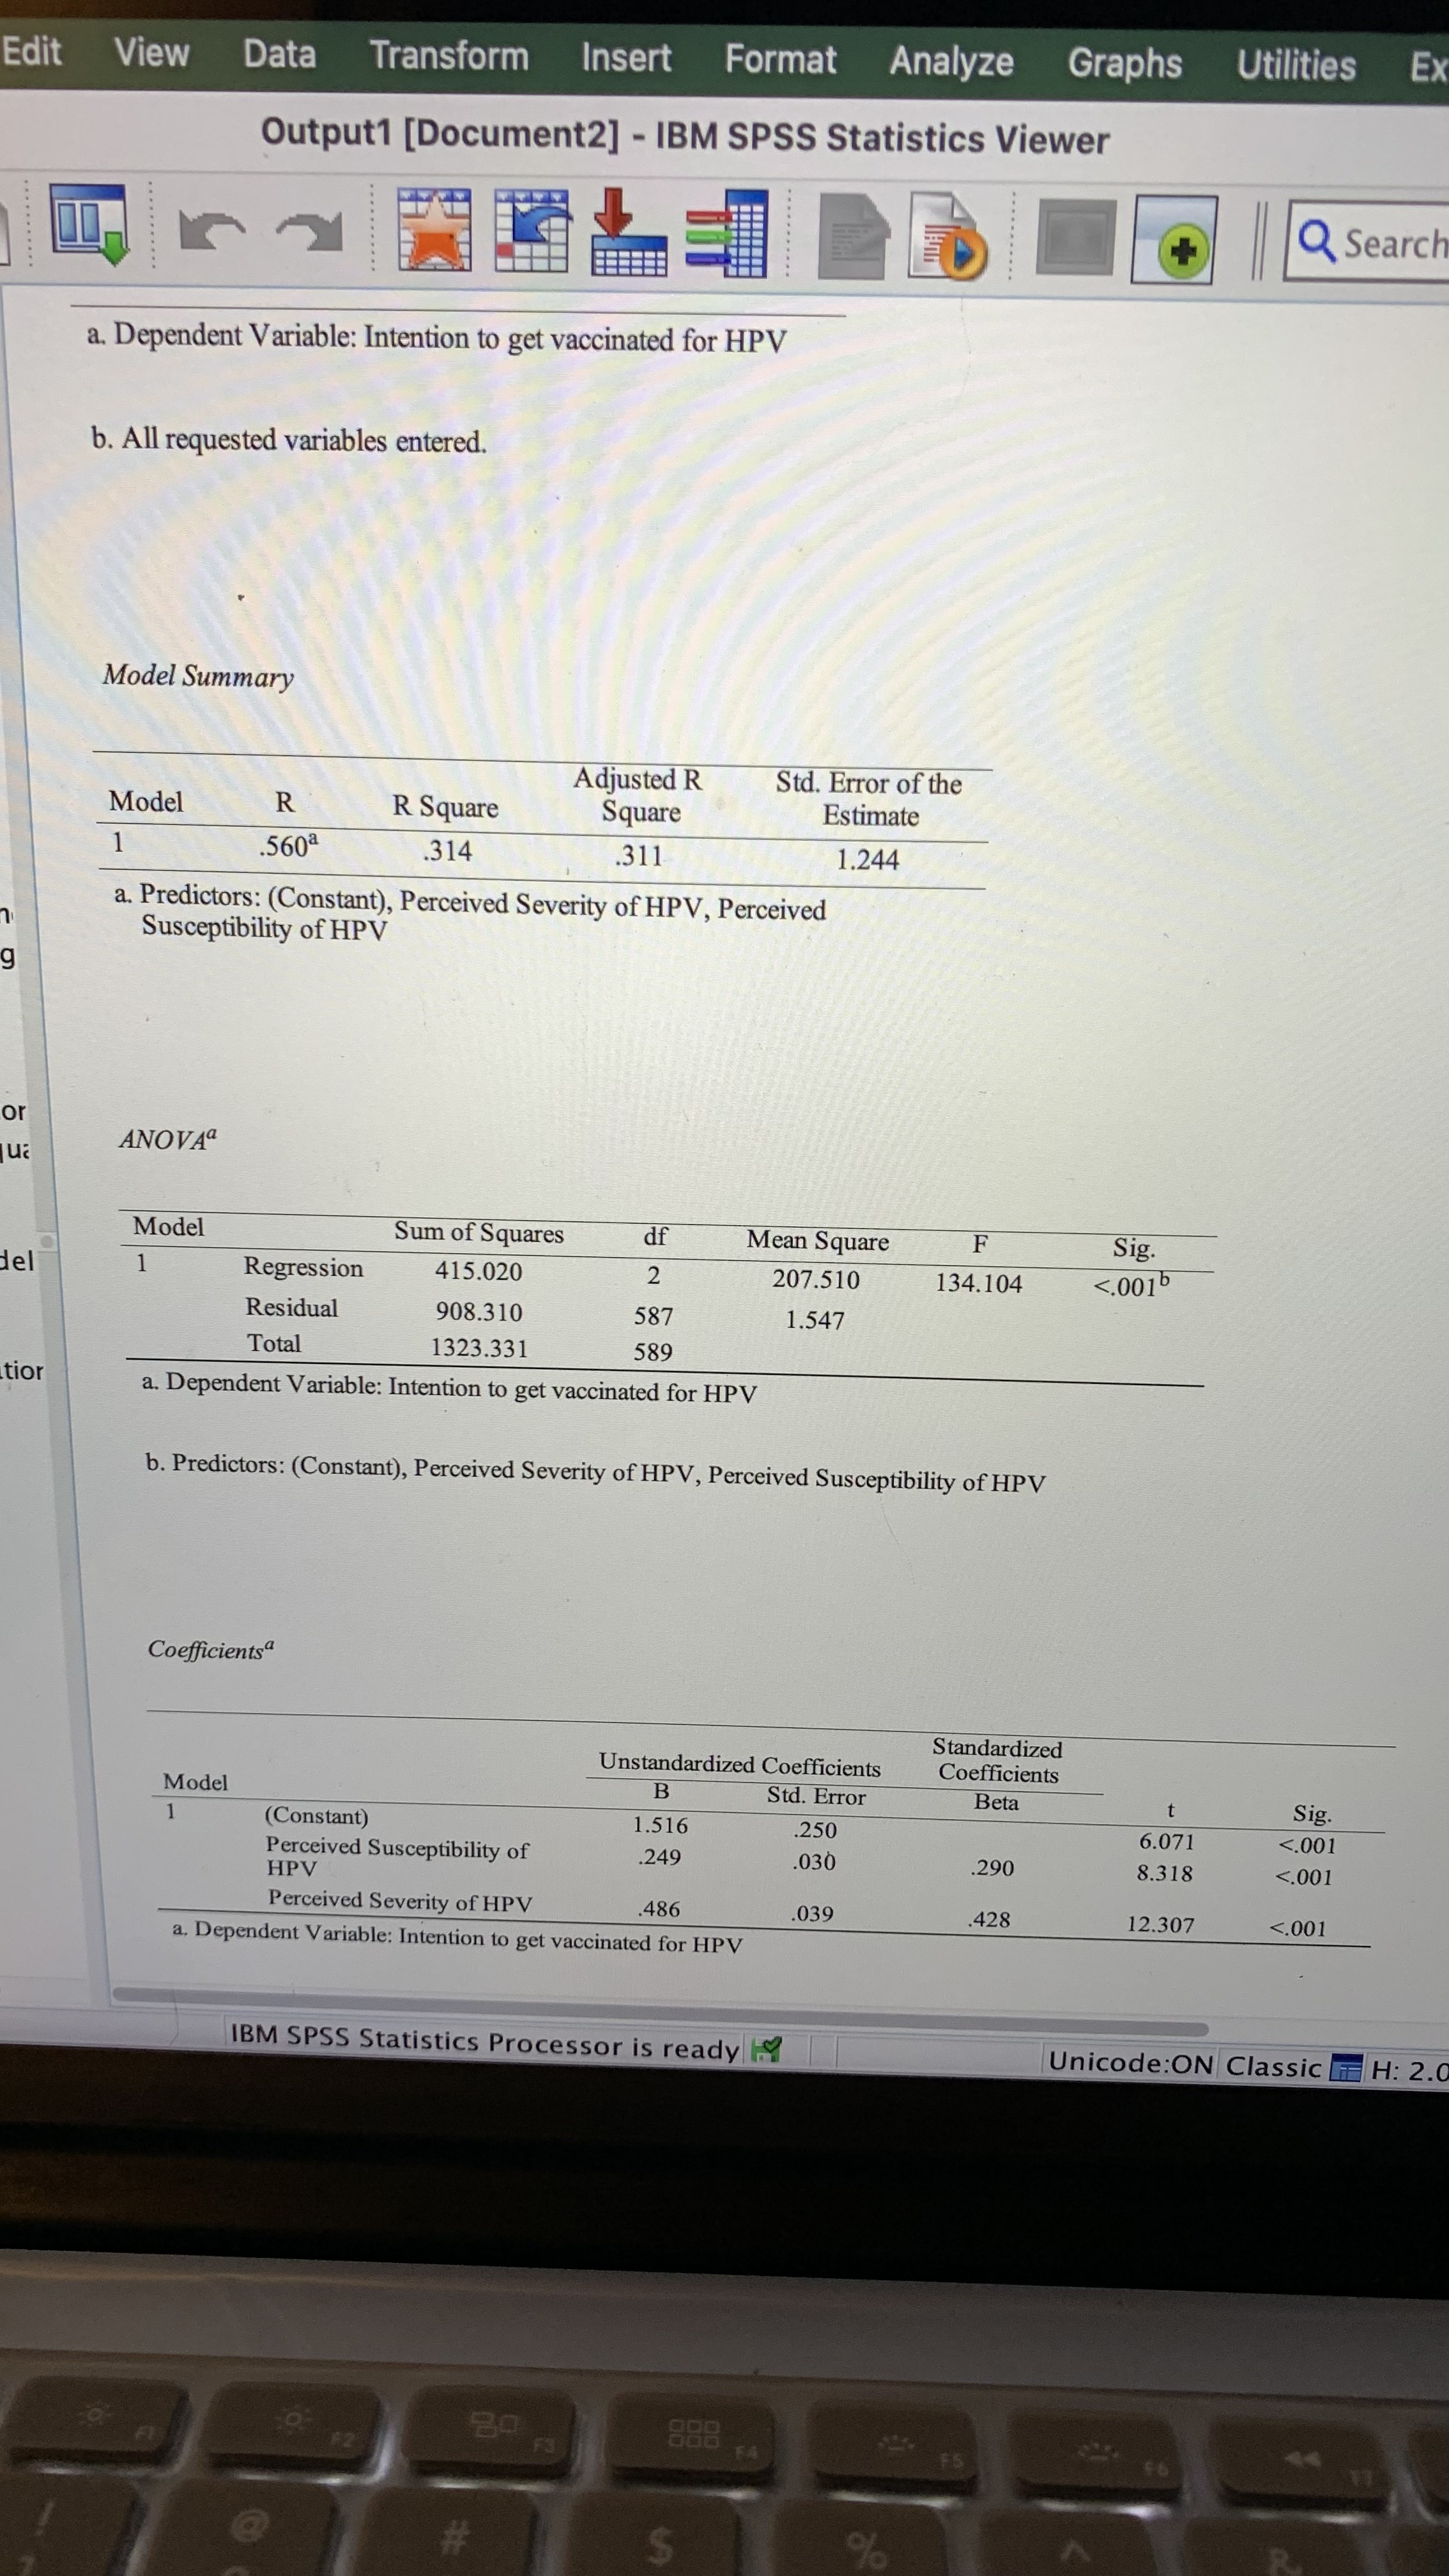
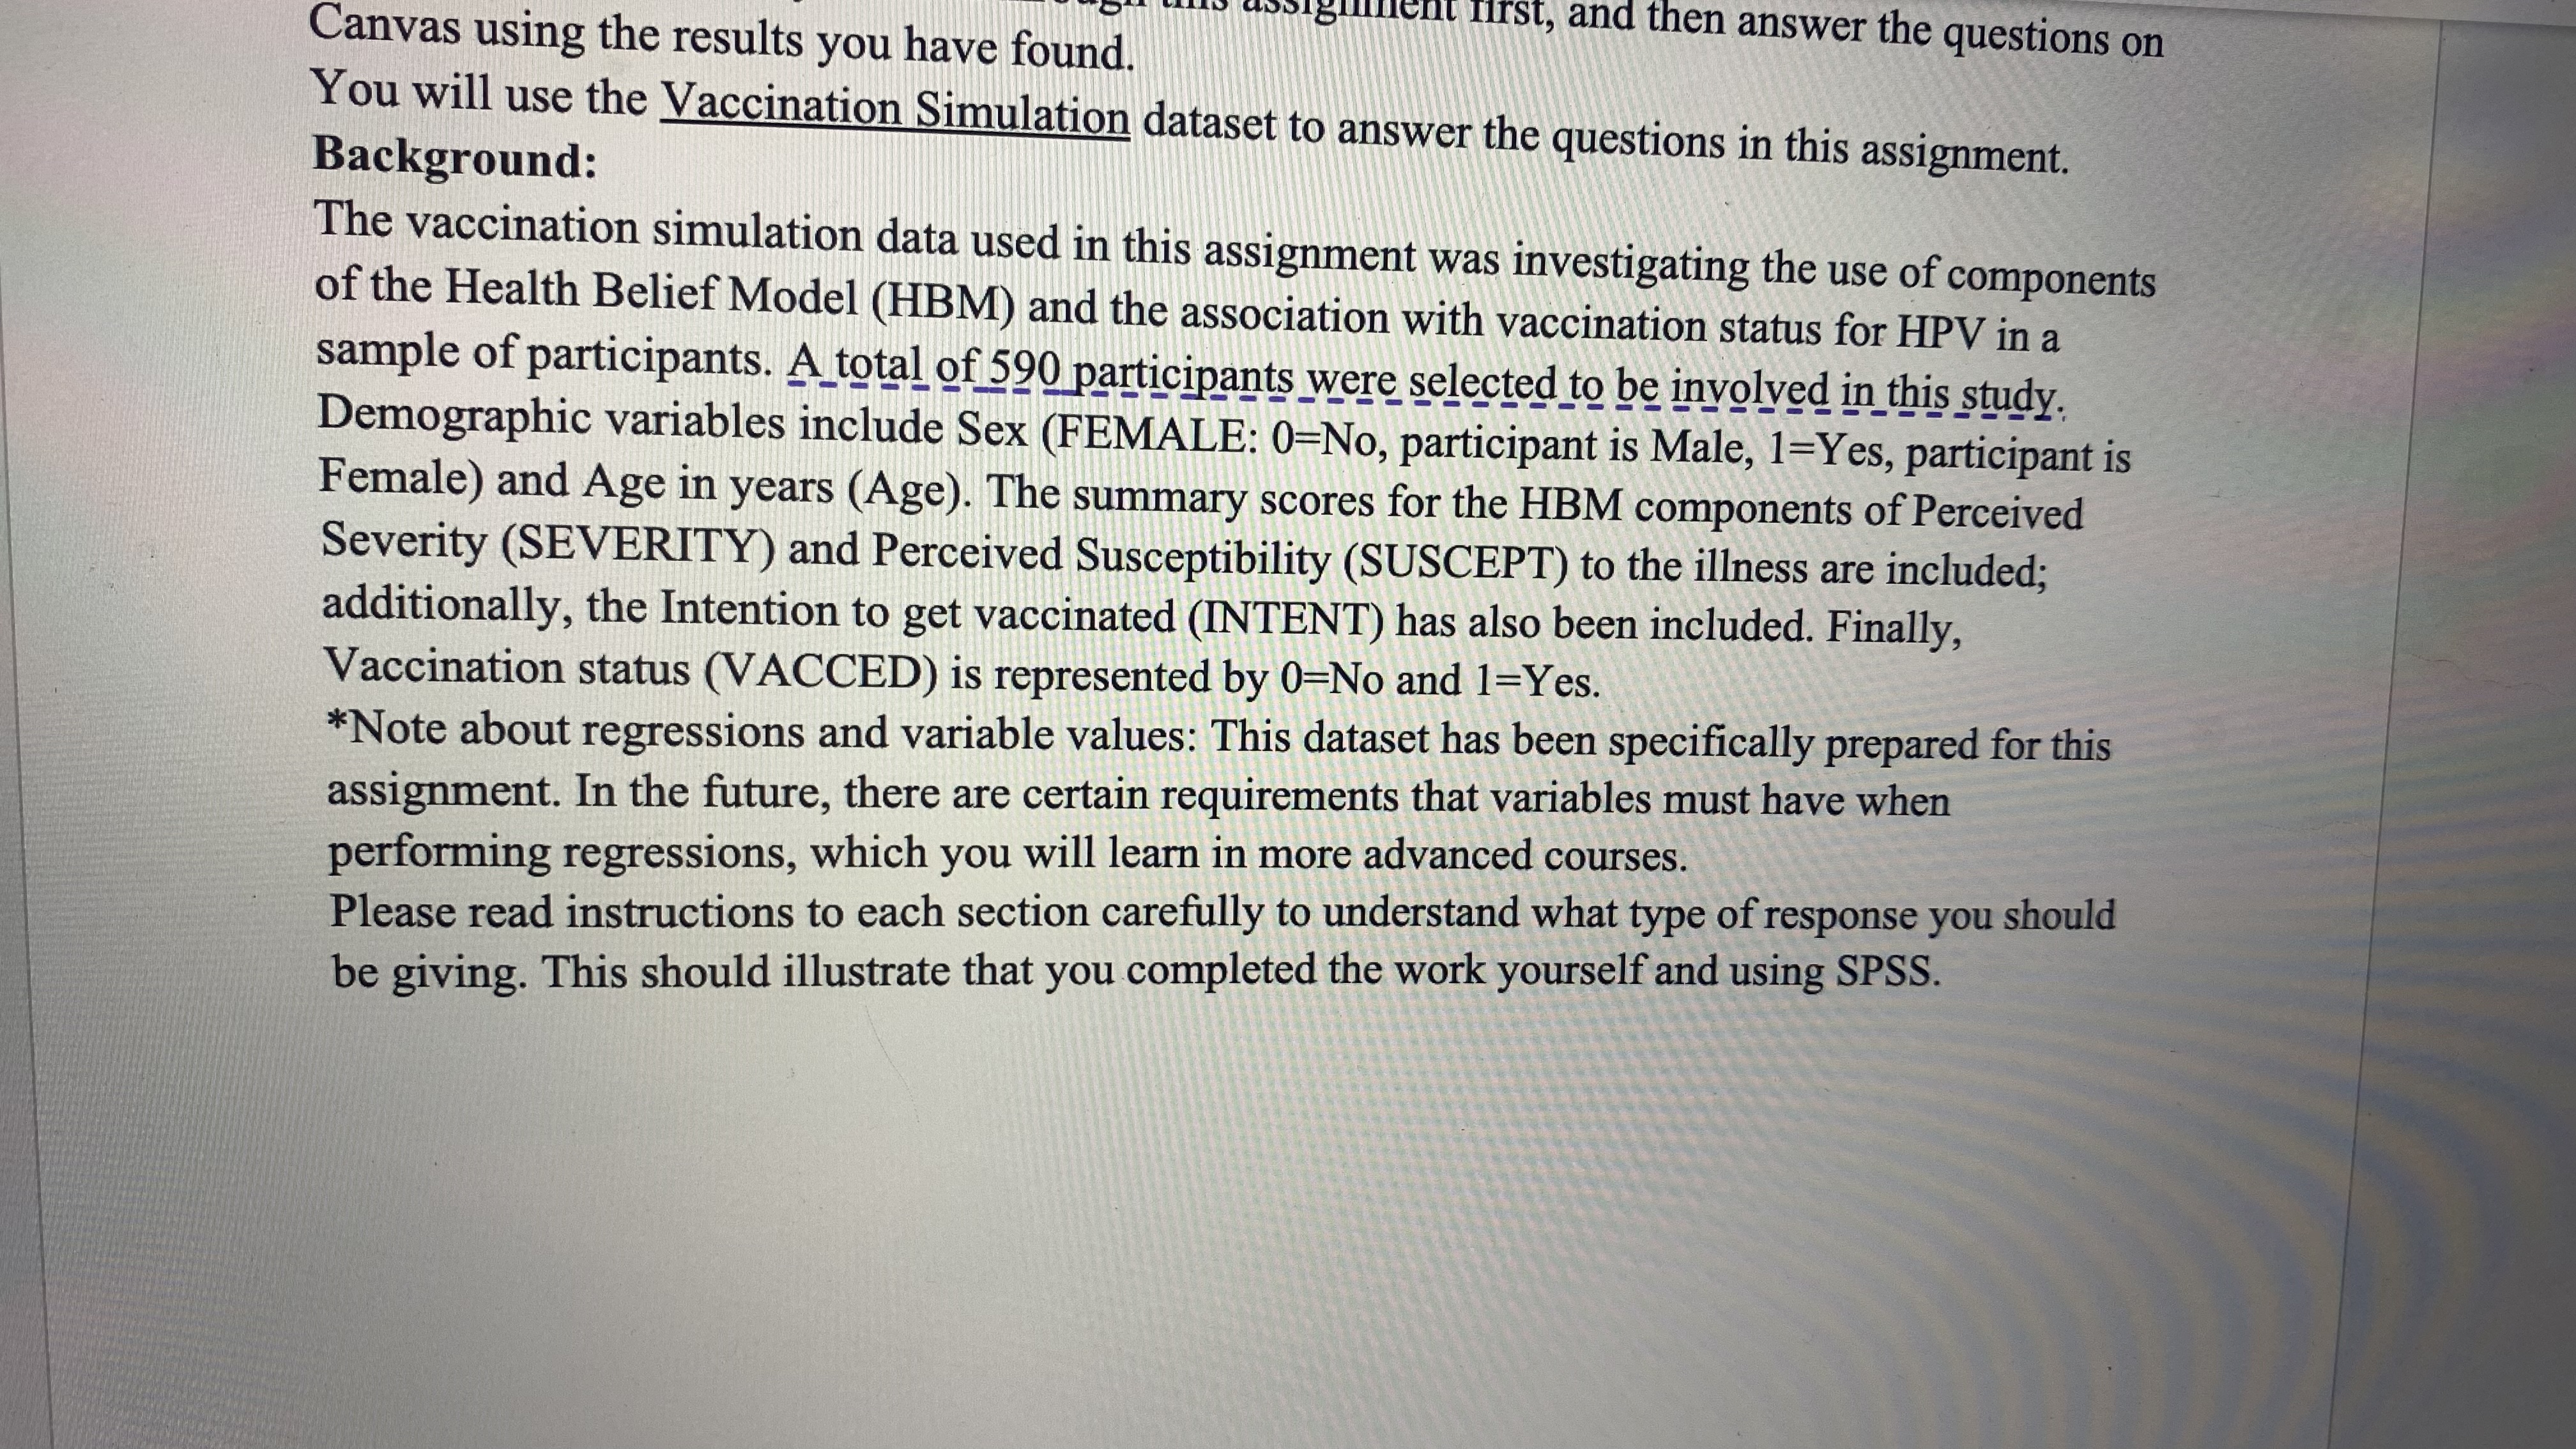
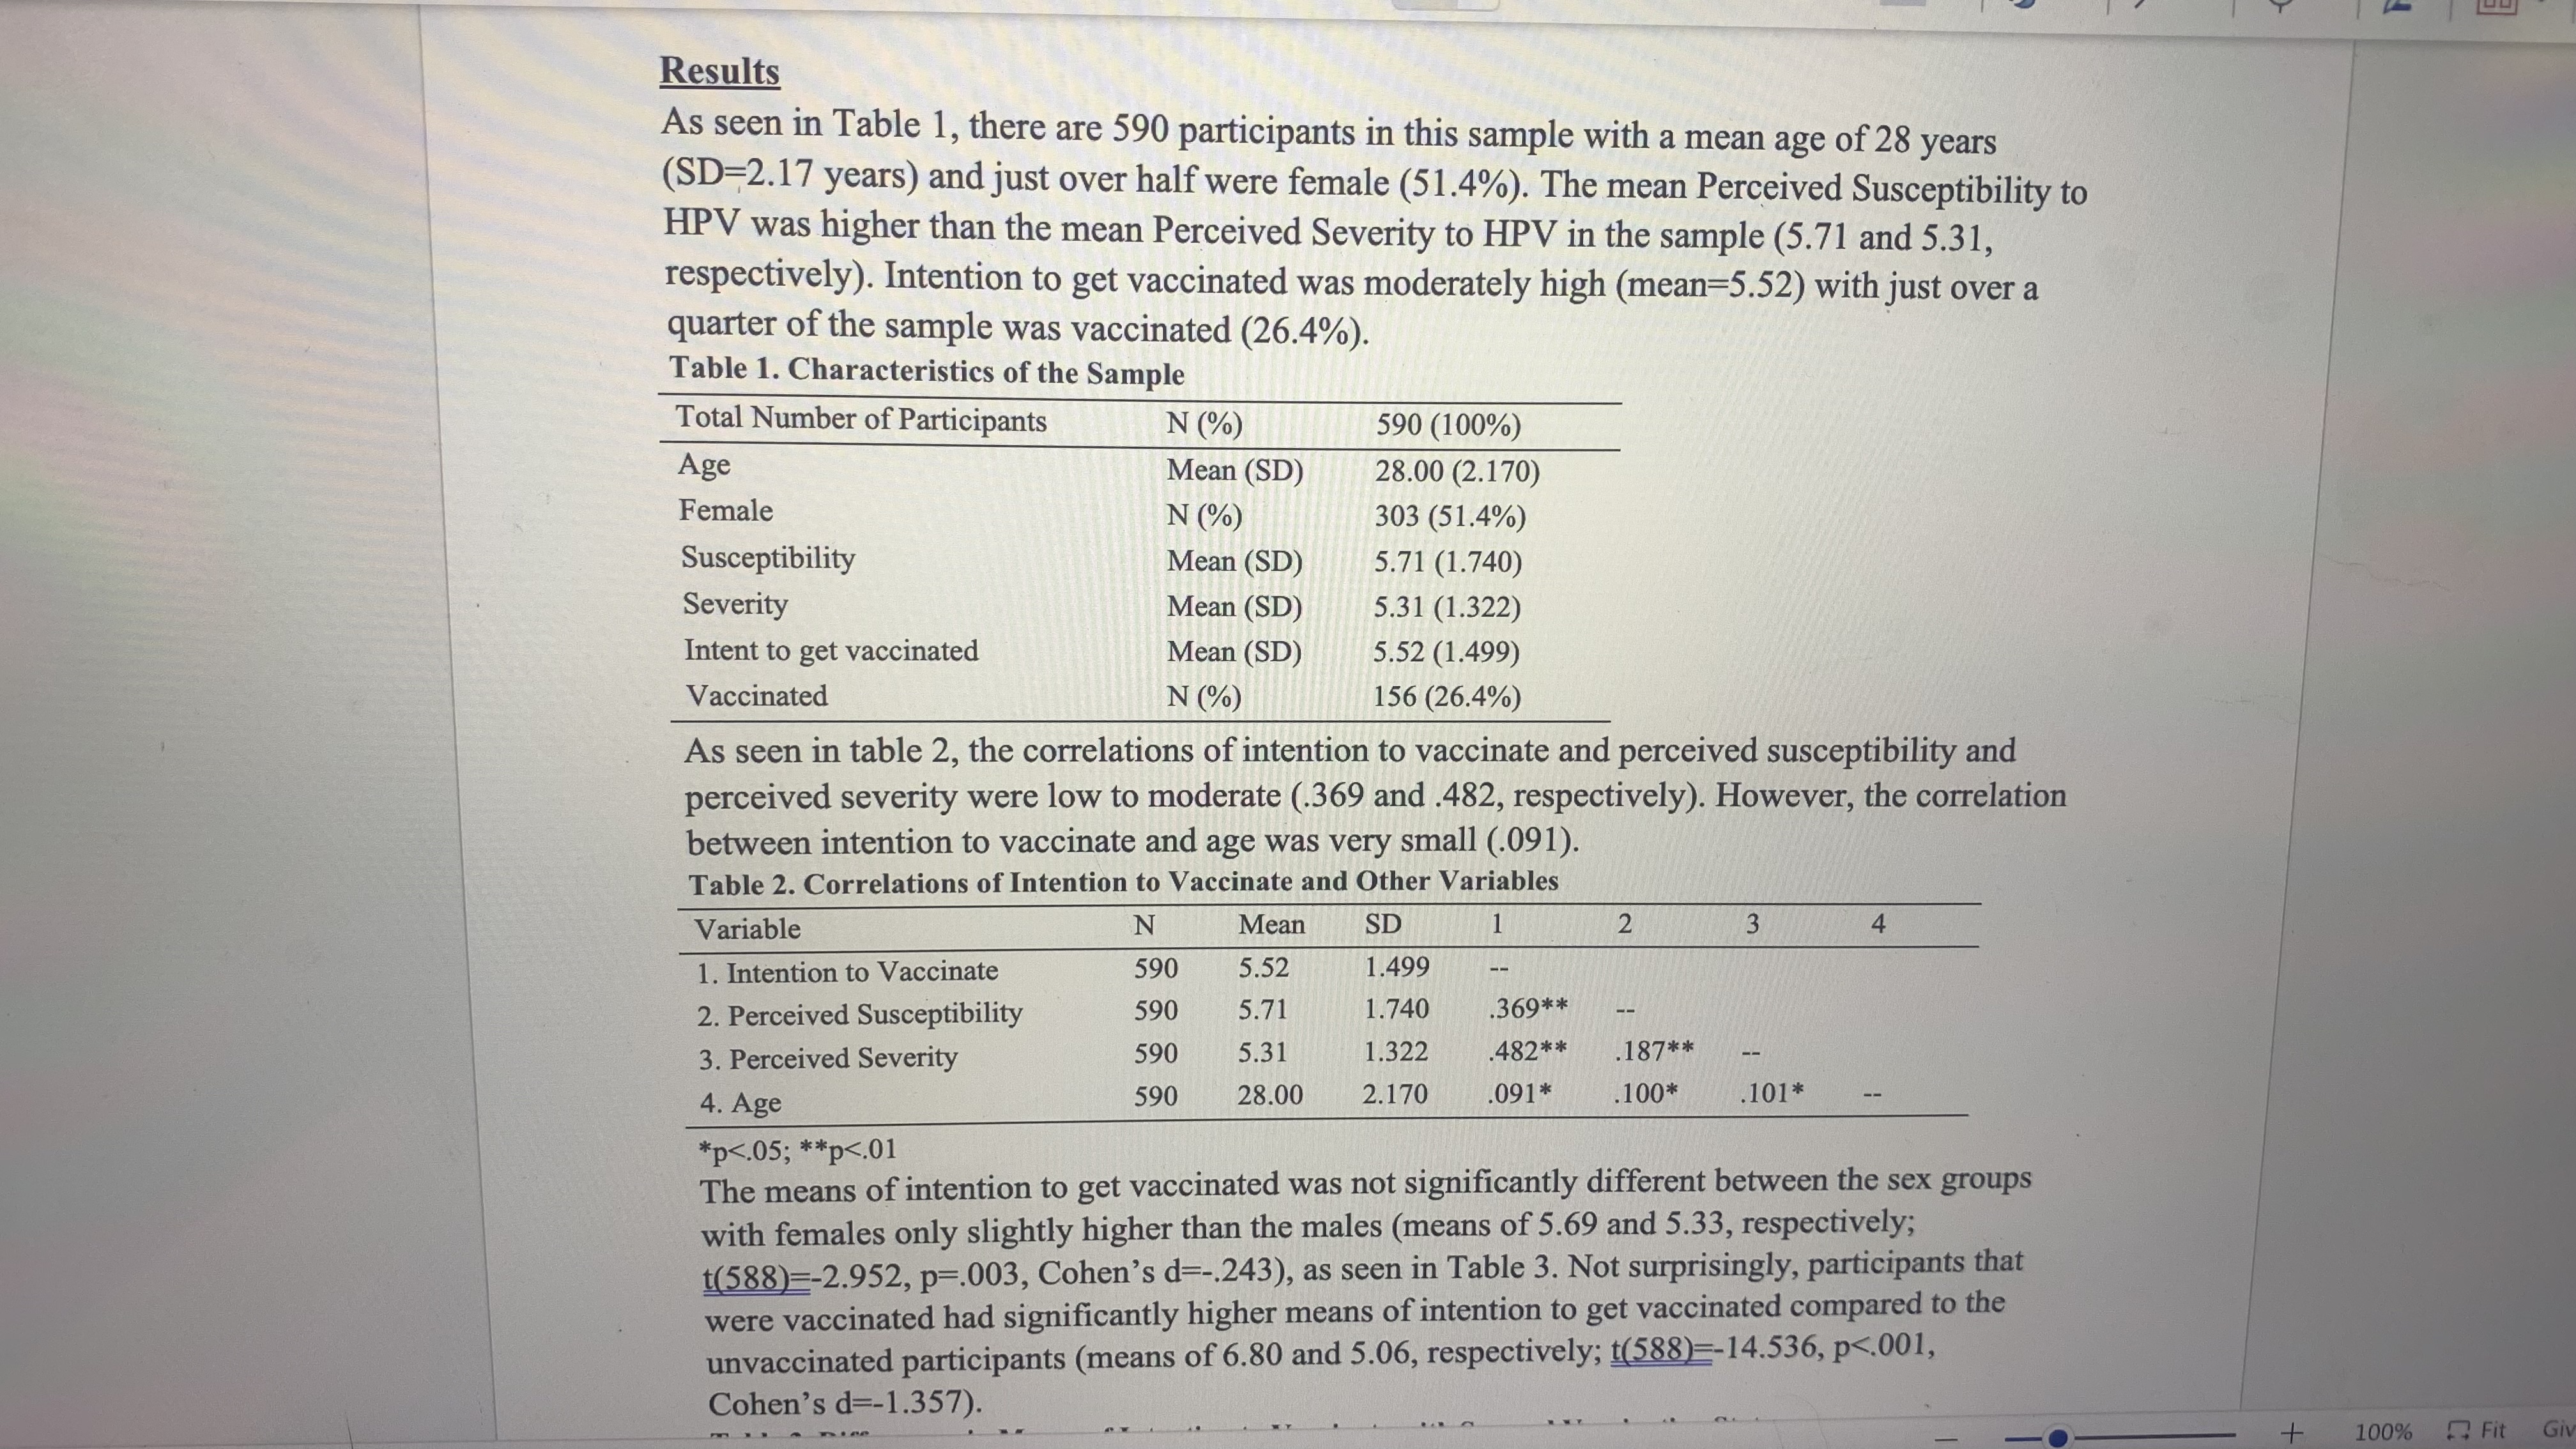
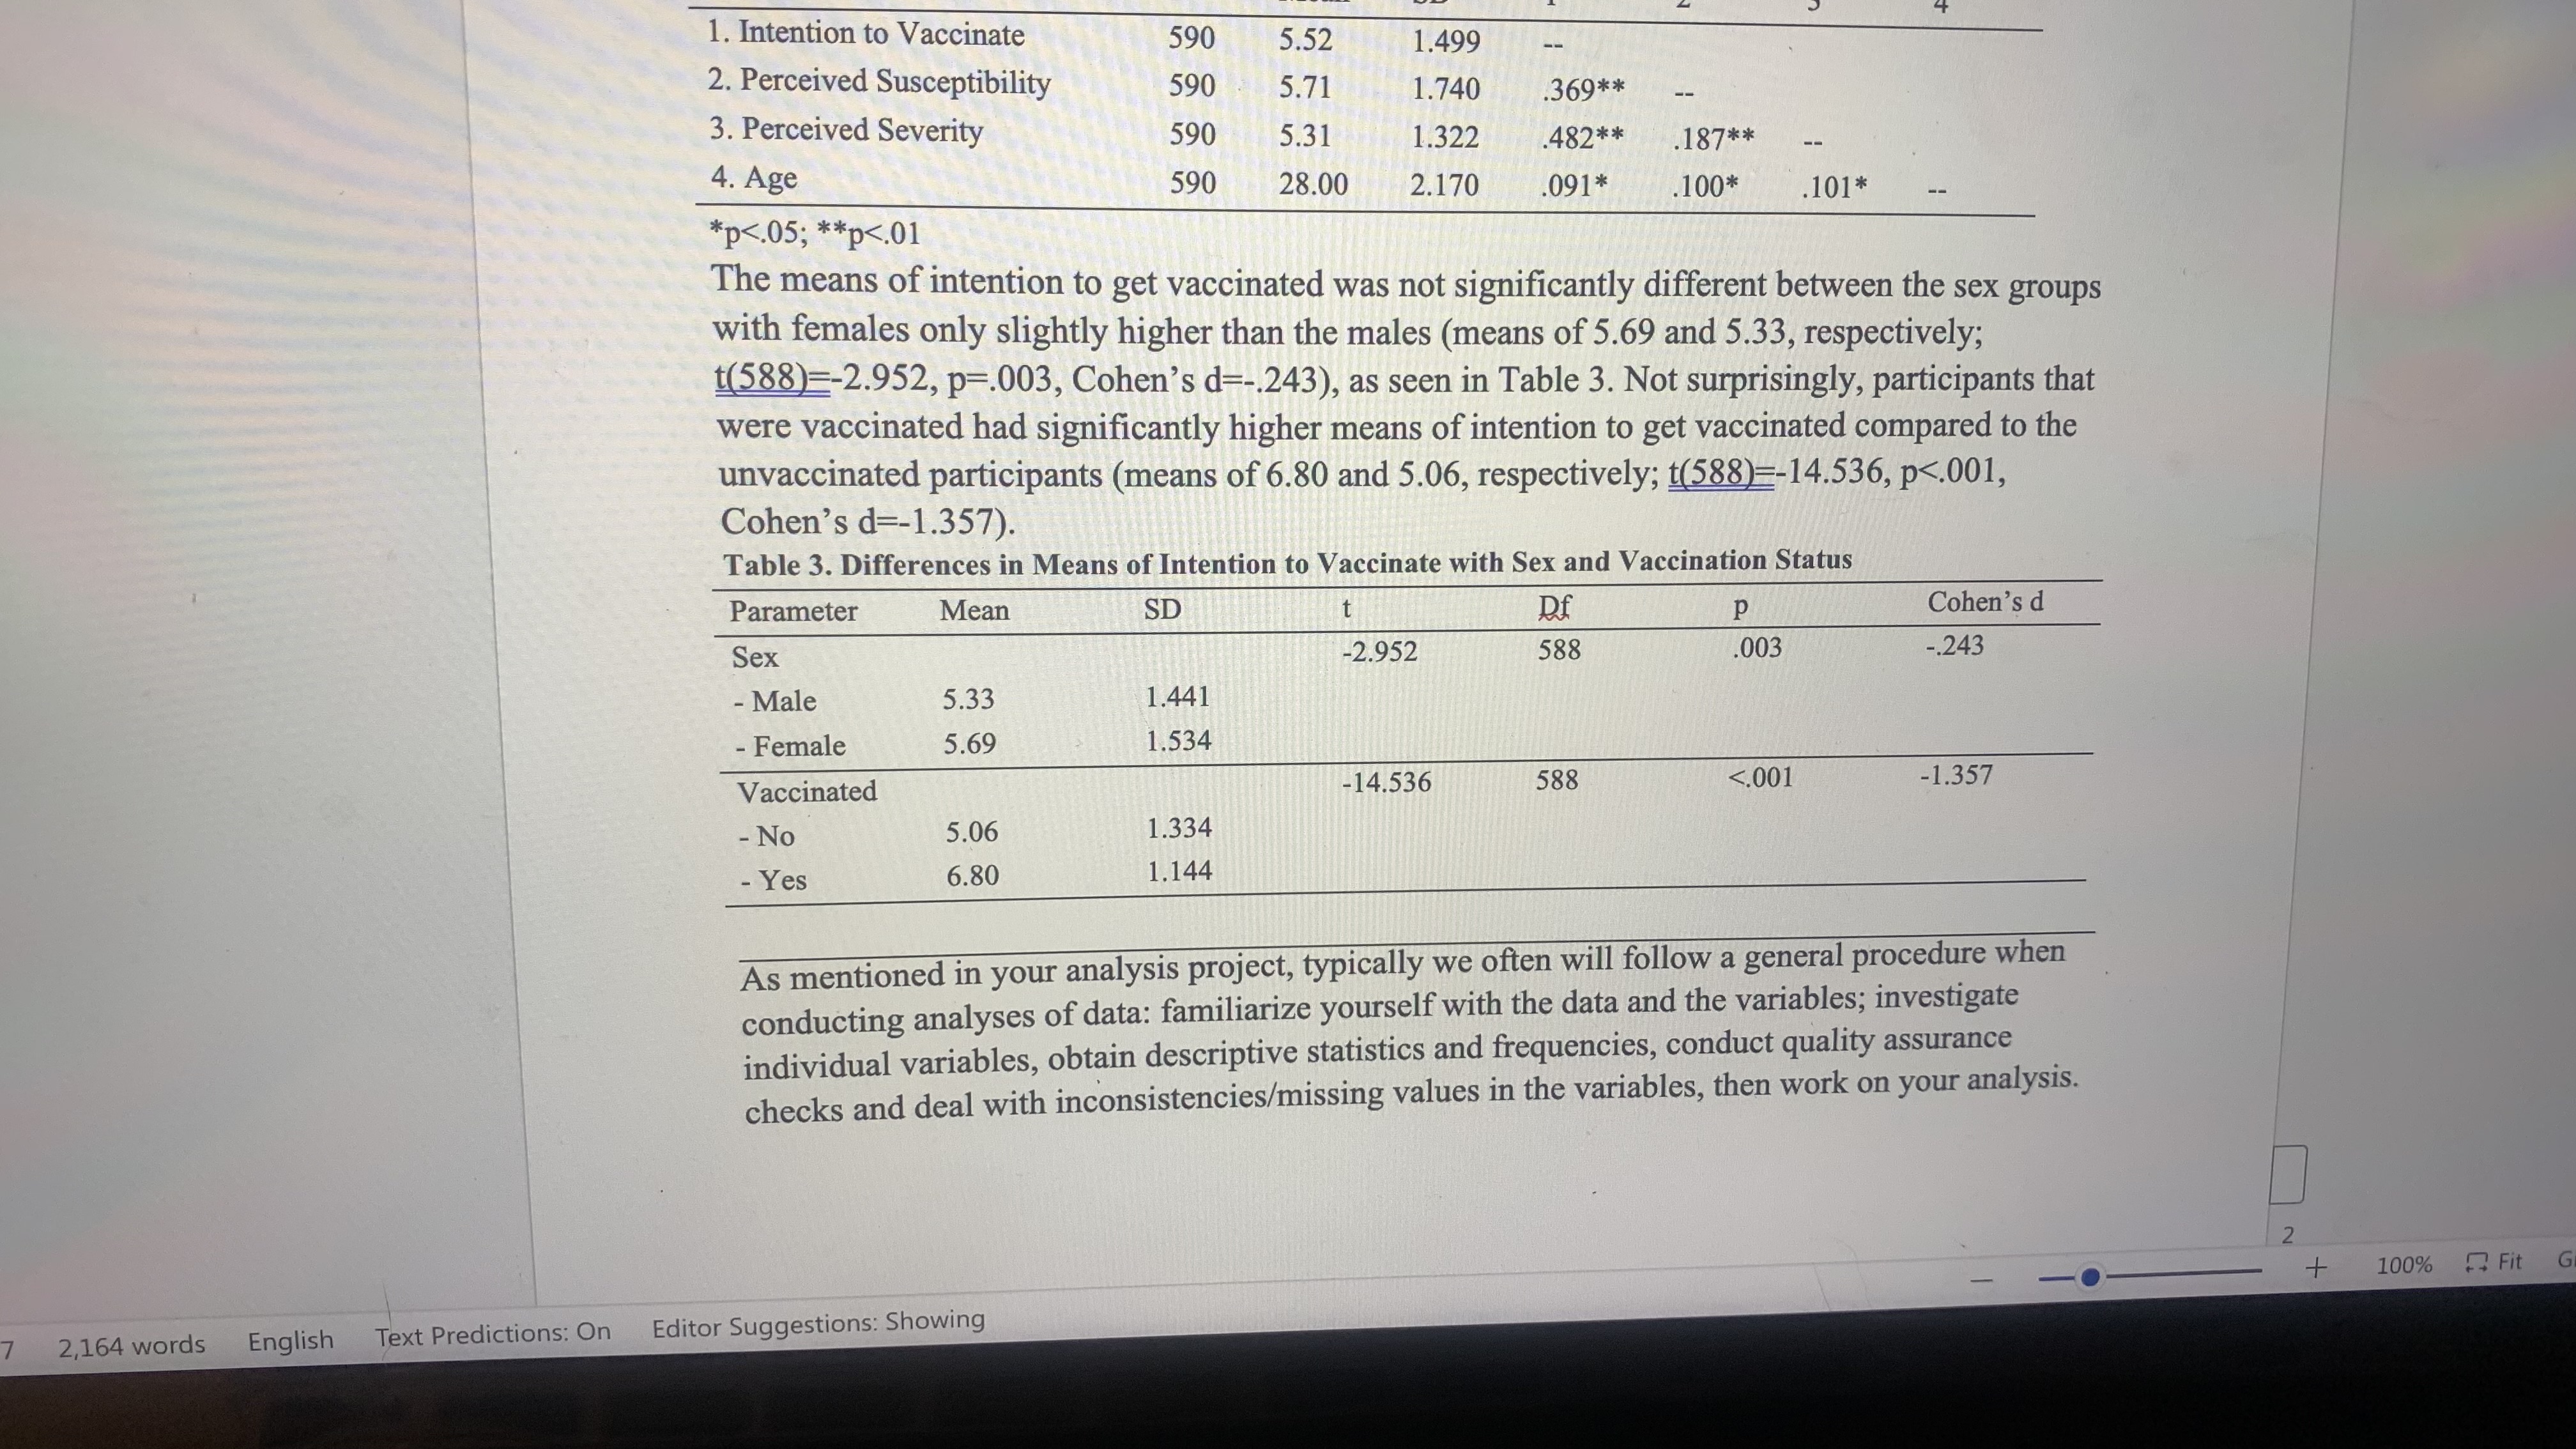
Edit View Data Transform Insert Format Analyze Graphs Utilities Extensio Output1 [Document2] - IBM SPSS Statistics Viewer Regression Descriptive Statistics Mean Std. Deviation N Intention to get vaccinated for 5.52 1.499 590 HPV Perceived Susceptibility of 5.71 1.740 590 HPV Perceived Severity of HPV 5.31 1.322 590 Correlations QSearch appl Intention to get vaccinated for Perceived Susceptibility of Perceived HPV HPV Severity of HPV or uz Pearson Correlation Intention to get vaccinated for HPV 1.000 .369 .482 Perceived Susceptibility of HPV .369 1.000 .187 el Perceived Severity of HPV .482 .187 1.000 Sig. (1-tailed) Intention to get vaccinated for Edit View Data Transform Insert Format Analyze Graphs Uti Output1 [Document2] - IBM SPSS Statistics Viewer Variables Entered/Removed Variables Model Entered ed 1 Perceived Variables Removed Method Enter Y odin ding "Severity of HPV, Perceived Susceptibility of HPVb a. Dependent Variable: Intention to get vaccinated for HPV b. All requested variables entered. uatior e Equa Model Summary er Model 1 R .560a R Square .314 Adjusted R Square Std. Error of the Estimate Model .311 a. Predictors: (Constant), Perceived Severity of HPV, Perceived Susceptibility of HPV 1.244 le quation ANOVA Model Sum of Squares df 1 Regression Residual 415.020 2 908.310 587 Mean Square 207.510 1.547 F Sig. 134.104 Edit View Data Transform g Insert Format Analyze Graphs Utilities Ex Output1 [Document2] - IBM SPSS Statistics Viewer a. Dependent Variable: Intention to get vaccinated for HPV b. All requested variables entered. Model Summary Model R 1 .560a R Square .314 Adjusted R Square Std. Error of the Estimate .311 a. Predictors: (Constant), Perceived Severity of HPV, Perceived Susceptibility of HPV 1.244 or ANOVA ua Model Sum of Squares df dell 1 Regression 415.020 2 Residual 908.310 587 Mean Square 207.510 1.547 F 134.104 Sig. Canvas using the results you have found. first, and then answer the questions on You will use the Vaccination Simulation dataset to answer the questions in this assignment. Background: components The vaccination simulation data used in this assignment was investigating the use of of the Health Belief Model (HBM) and the association with vaccination status for HPV in a sample of participants. A total of 590 participants were selected to be involved in this study. Demographic variables include Sex (FEMALE: 0=No, participant is Male, 1=Yes, participant is Female) and Age in years (Age). The summary scores for the HBM components of Perceived Severity (SEVERITY) and Perceived Susceptibility (SUSCEPT) to the illness are included; additionally, the Intention to get vaccinated (INTENT) has also been included. Finally, Vaccination status (VACCED) is represented by 0=No and 1=Yes. *Note about regressions and variable values: This dataset has been specifically prepared for this assignment. In the future, there are certain requirements that variables must have when performing regressions, which you will learn in more advanced courses. Please read instructions to each section carefully to understand what type of response you should be giving. This should illustrate that you completed the work yourself and using SPSS. Results As seen in Table 1, there are 590 participants in this sample with a mean age of 28 years (SD=2.17 years) and just over half were female (51.4%). The mean Perceived Susceptibility to HPV was higher than the mean Perceived Severity to HPV in the sample (5.71 and 5.31, respectively). Intention to get vaccinated was moderately high (mean=5.52) with just over a quarter of the sample was vaccinated (26.4%). Table 1. Characteristics of the Sample Total Number of Participants Age Female Susceptibility Severity Intent to get vaccinated Vaccinated N (%) 590 (100%) Mean (SD) 28.00 (2.170) N (%) 303 (51.4%) Mean (SD) 5.71 (1.740) Mean (SD) 5.31 (1.322) Mean (SD) 5.52 (1.499) N(%) 156 (26.4%) As seen in table 2, the correlations of intention to vaccinate and perceived susceptibility and perceived severity were low to moderate (.369 and .482, respectively). However, the correlation between intention to vaccinate and age was very small (.091). Table 2. Correlations of Intention to Vaccinate and Other Variables Variable N Mean SD 1 2 3 4 1. Intention to Vaccinate 590 5.52 1.499 -- 2. Perceived Susceptibility 590 5.71 1.740 .369** 3. Perceived Severity 590 5.31 1.322 .482** .187** 11 4. Age 590 28.00 2.170 .091* .100* .101* *p 1. Intention to Vaccinate 590 5.52 1.499 2. Perceived Susceptibility 590 5.71 1.740 .369** 3. Perceived Severity 590 5.31 4. Age 590 1.322 28.00 2.170 .091* .482** .187** .100* .101* *p ExtLash Re 1. Is the Al mew the Capical bon Se Thes change the Cod Re (This bed the ack 96
Step by Step Solution
There are 3 Steps involved in it

Get step-by-step solutions from verified subject matter experts