

Question: Edit View Data Transform Insert Format Analyze Graphs Utilities Extensio Output1 [Document2] - IBM SPSS Statistics Viewer Regression Descriptive Statistics Mean Std. Deviation N
![Edit View Data Transform Insert Format Analyze Graphs Utilities Extensio Output1 [Document2]](https://s3.amazonaws.com/si.experts.images/answers/2024/05/6647d4be6df5d_5506647d4be196e9.jpg)
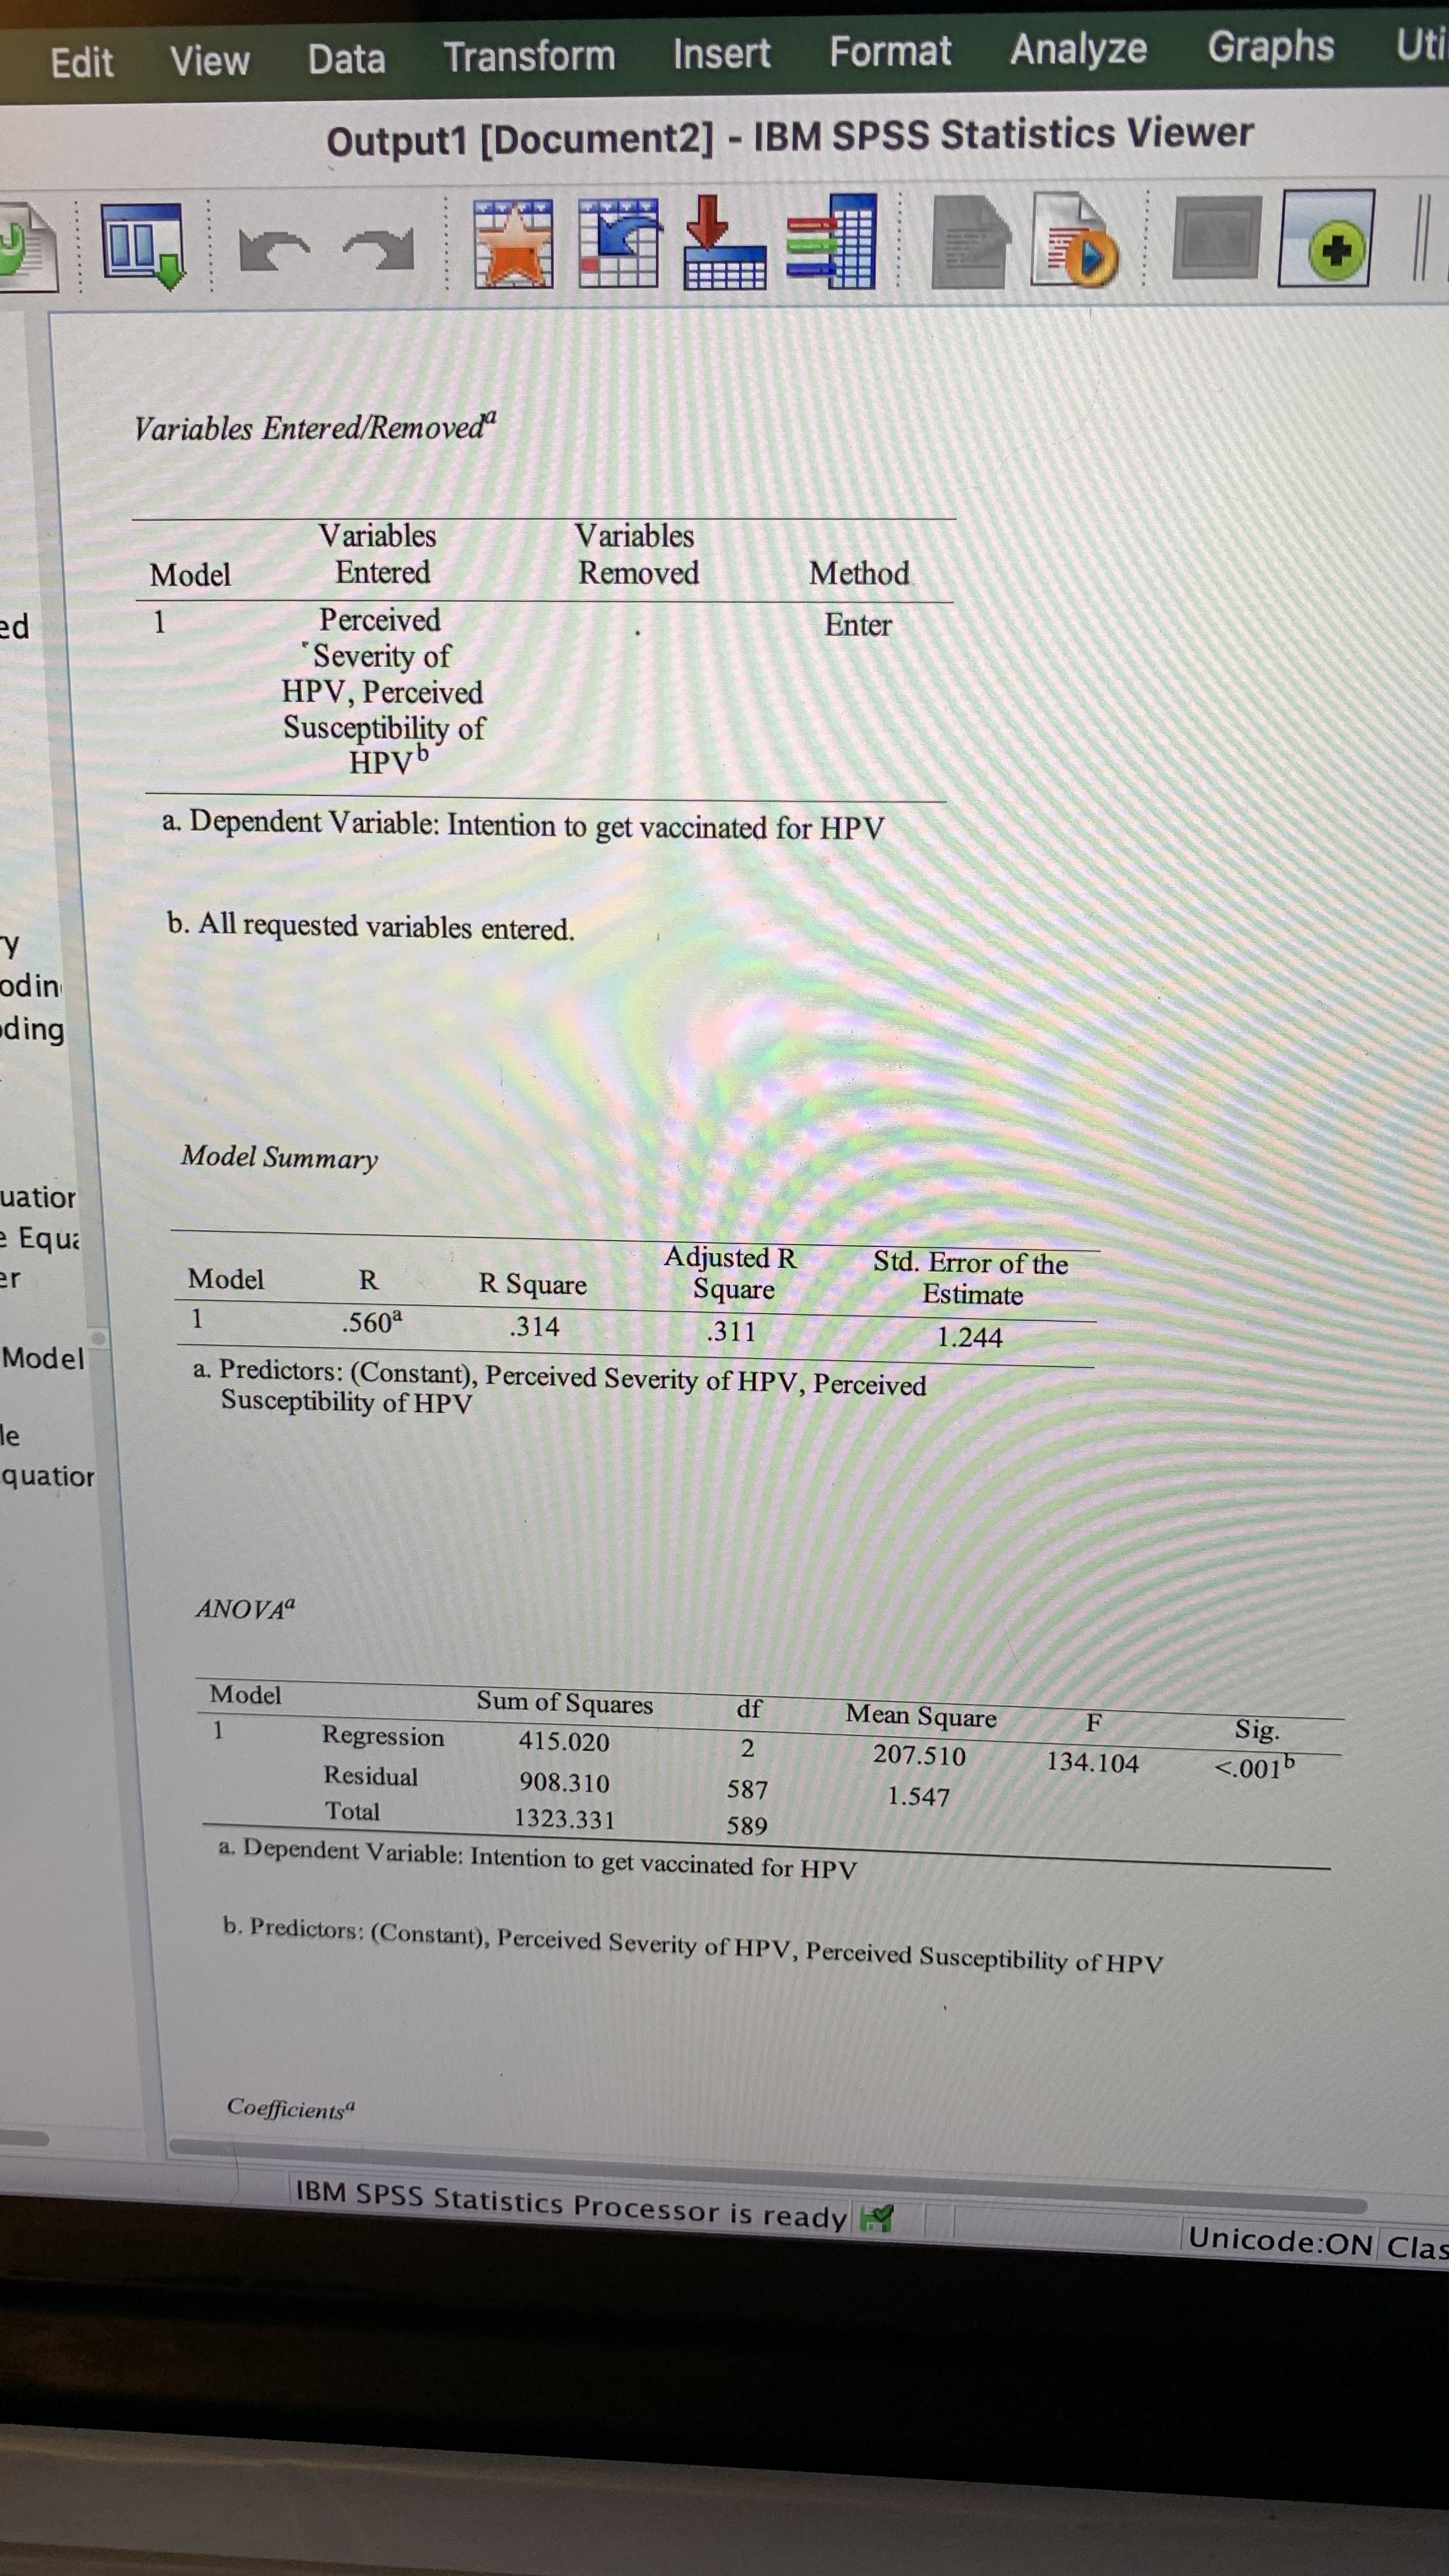
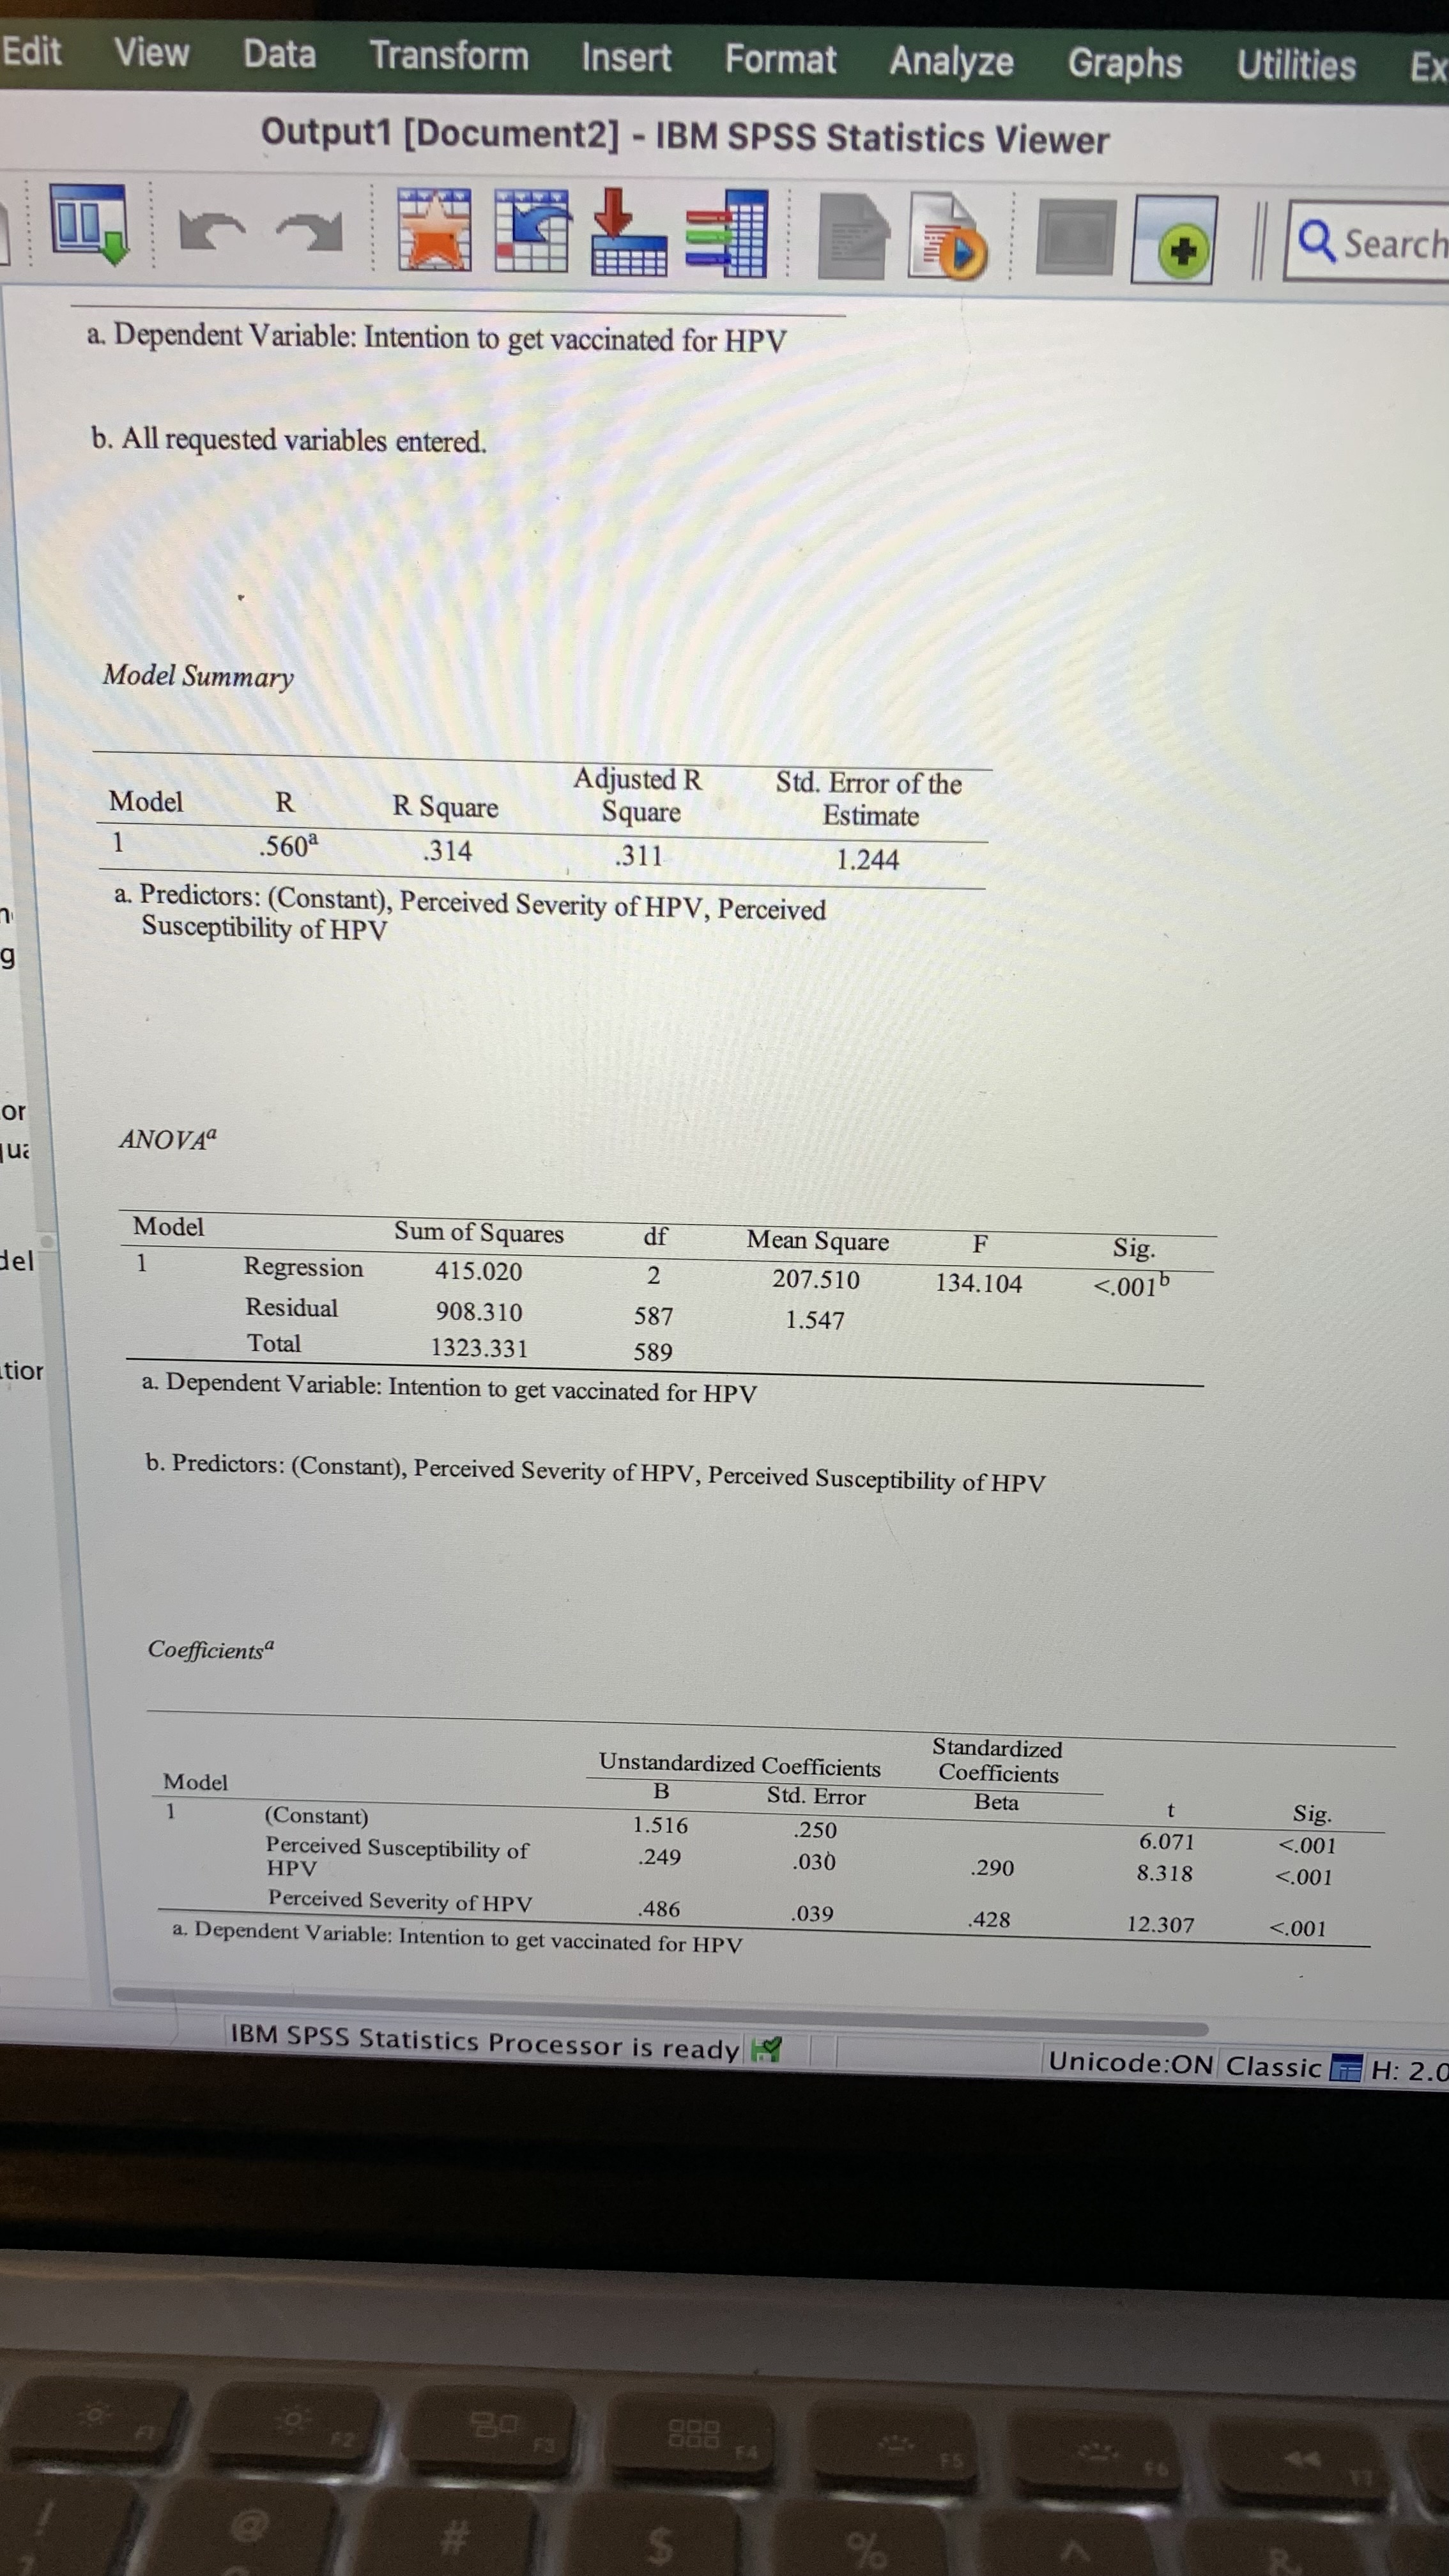
Edit View Data Transform Insert Format Analyze Graphs Utilities Extensio Output1 [Document2] - IBM SPSS Statistics Viewer Regression Descriptive Statistics Mean Std. Deviation N Intention to get vaccinated for 5.52 1.499 590 HPV Perceived Susceptibility of 5.71 1.740 590 HPV Perceived Severity of HPV 5.31 1.322 590 Correlations QSearch appl Intention to get vaccinated for Perceived Susceptibility of Perceived HPV HPV Severity of HPV or uz Pearson Correlation Intention to get vaccinated for HPV 1.000 .369 .482 Perceived Susceptibility of HPV .369 1.000 .187 el Perceived Severity of HPV .482 .187 1.000 Sig. (1-tailed) Intention to get vaccinated for Edit View Data Transform Insert Format Analyze Graphs Uti Output1 [Document2] - IBM SPSS Statistics Viewer Variables Entered/Removed Variables Model Entered ed 1 Perceived Variables Removed Method Enter Y odin ding "Severity of HPV, Perceived Susceptibility of HPVb a. Dependent Variable: Intention to get vaccinated for HPV b. All requested variables entered. uatior e Equa Model Summary er Model 1 R .560a R Square .314 Adjusted R Square Std. Error of the Estimate Model .311 a. Predictors: (Constant), Perceived Severity of HPV, Perceived Susceptibility of HPV 1.244 le quation ANOVA Model Sum of Squares df 1 Regression Residual 415.020 2 908.310 587 Mean Square 207.510 1.547 F Sig. 134.104 Edit View Data Transform g Insert Format Analyze Graphs Utilities Ex Output1 [Document2] - IBM SPSS Statistics Viewer a. Dependent Variable: Intention to get vaccinated for HPV b. All requested variables entered. Model Summary Model R 1 .560a R Square .314 Adjusted R Square Std. Error of the Estimate .311 a. Predictors: (Constant), Perceived Severity of HPV, Perceived Susceptibility of HPV 1.244 or ANOVA ua Model Sum of Squares df dell 1 Regression 415.020 2 Residual 908.310 587 Mean Square 207.510 1.547 F 134.104 Sig.
Step by Step Solution
There are 3 Steps involved in it

Get step-by-step solutions from verified subject matter experts