

Question: Edit View Insert Format Tools In- lab Crack Size Reading 12pt v Paragraph B Based on the scatterplot above, the correlation between in- v v
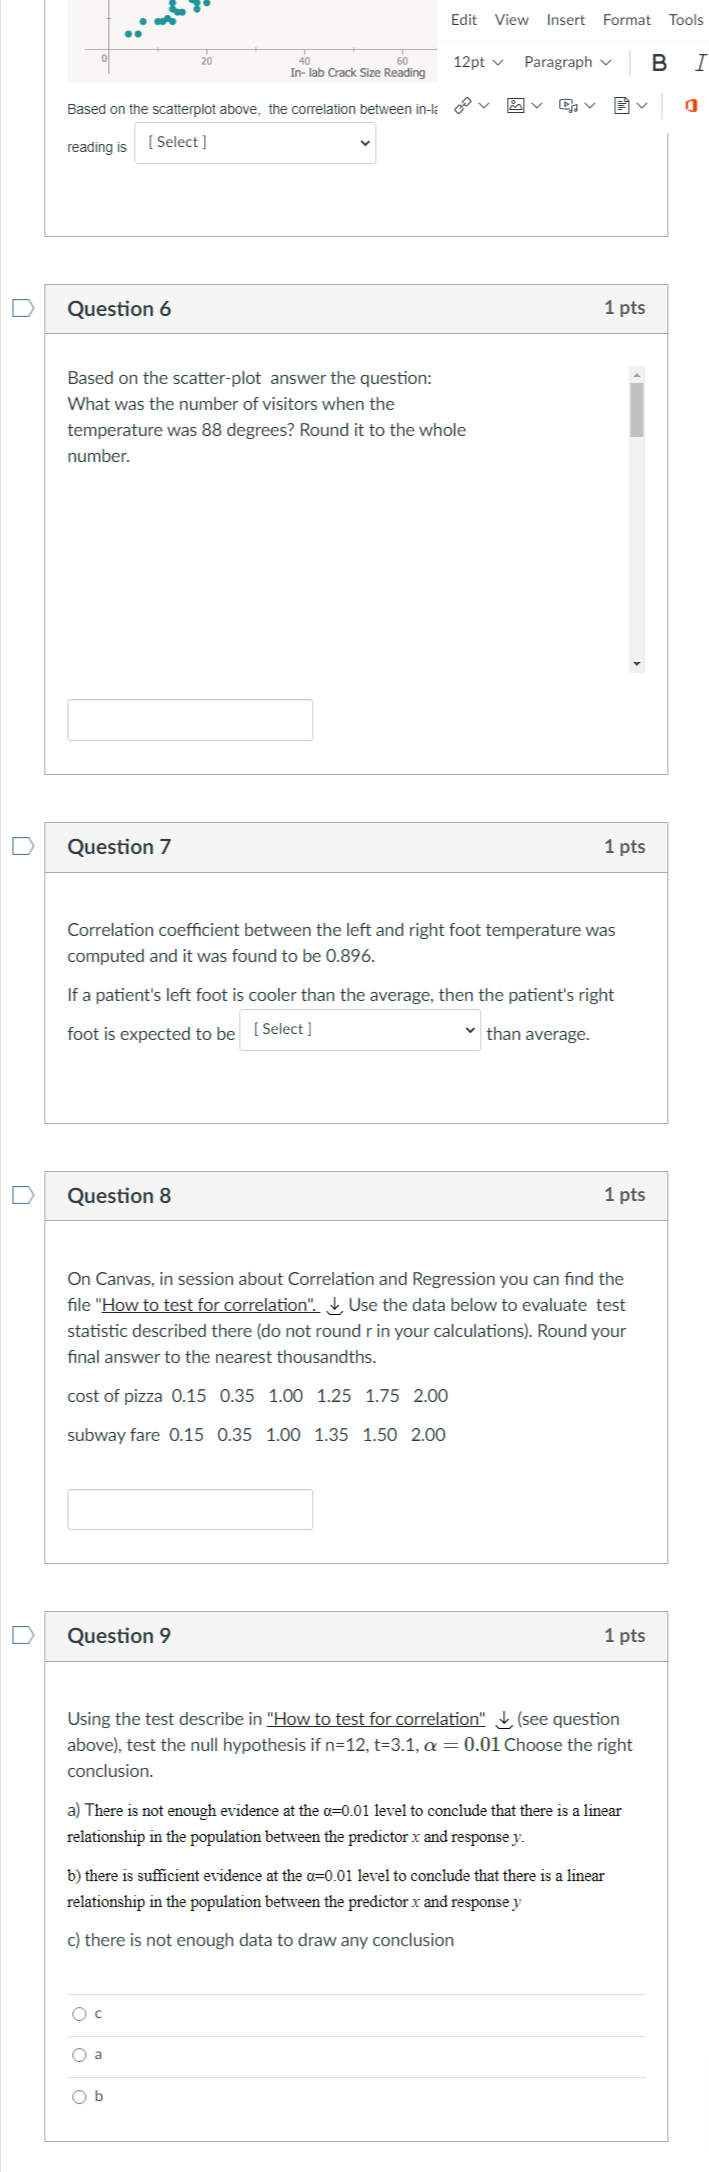
Edit View Insert Format Tools In- lab Crack Size Reading 12pt v Paragraph B Based on the scatterplot above, the correlation between in- v v Q v By reading is [Select ] D Question 6 1 pts Based on the scatter-plot answer the question: What was the number of visitors when the temperature was 88 degrees? Round it to the whole number. D Question 7 1 pts Correlation coefficient between the left and right foot temperature was computed and it was found to be 0.896. If a patient's left foot is cooler than the average, then the patient's right foot is expected to be [ Select ] than average. D Question 8 1 pts On Canvas, in session about Correlation and Regression you can find the file "How to test for correlation". & Use the data below to evaluate test statistic described there (do not round r in your calculations). Round your final answer to the nearest thousandths. cost of pizza 0.15 0.35 1.00 1.25 1.75 2.00 subway fare 0.15 0.35 1.00 1.35 1.50 2.00 D Question 9 1 pts Using the test describe in "How to test for correlation" & (see question above), test the null hypothesis if n=12, t=3.1, a = 0.01 Choose the right conclusion. a) There is not enough evidence at the a=0.01 level to conclude that there is a linear relationship in the population between the predictor x and response y. b) there is sufficient evidence at the a=0.01 level to conclude that there is a linear relationship in the population between the predictor x and response y c) there is not enough data to draw any conclusion O c O a Ob
Step by Step Solution
There are 3 Steps involved in it

Get step-by-step solutions from verified subject matter experts