

Question: EExplain clearly Q: 05: Construct table and diagram with the help of following Demand equation. Qd= 100-5p Q:10: By using following data show market equilibrium
EExplain clearly
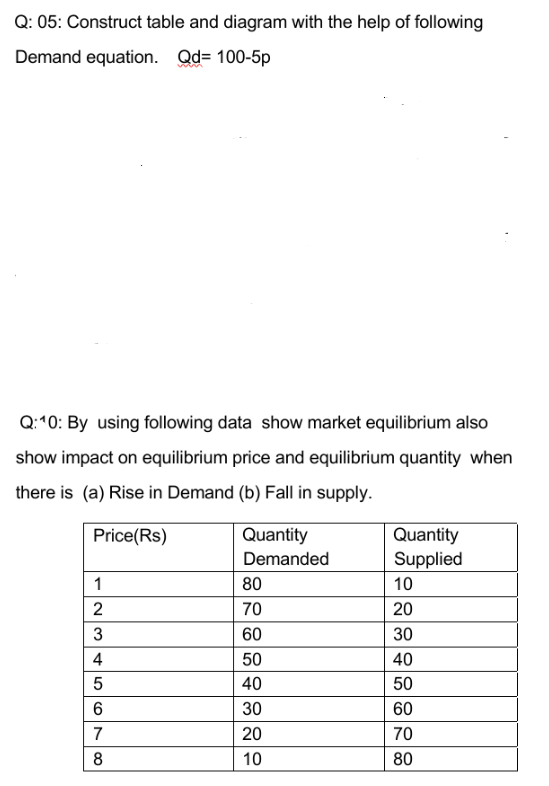
Q: 05: Construct table and diagram with the help of following Demand equation. Qd= 100-5p Q:10: By using following data show market equilibrium also show impact on equilibrium price and equilibrium quantity when there is (a) Rise in Demand (b) Fall in supply. Price(Rs) Quantity Quantity Demanded Supplied 1 80 10 2 70 20 3 60 30 4 50 40 5 40 50 6 30 60 20 70 8 10 80
Step by Step Solution
There are 3 Steps involved in it
1 Expert Approved Answer
Step: 1 Unlock

Question Has Been Solved by an Expert!
Get step-by-step solutions from verified subject matter experts
Step: 2 Unlock
Step: 3 Unlock