

Question: Effect Size and Meta-Analysis Research Topic: The effect of visual skills on the batting performance of NCAA Division I softball players. Topic Questions: 75.1 Do
Effect Size and Meta-Analysis
Research Topic: The effect of visual skills on the batting performance of NCAA Division I softball players.
Topic Questions:
75.1 Do you plan to report value(s) ofdin the results section of your research report? Explain.
76.1 Will you be comparing the difference between two means in your analysis? If so, do you expect to find a statistically significant difference? Do you expect to find a large value ofd? Explain.
77.1 In this topic, there is an example of an experiment and an example of a correlational study. Will you be conducting either type of study? Explain.
78.1 Some institutions (and journals) consider a meta-analysis to be work of original research even though it is based on a reanalysis of the research results created by others. If you are planning to conduct research, would you be interested in conducting a meta-analysis as your research project? Explain.
79.1 Reconsider your answer to Question 78.1 in light of what you learned in this topic. Has your answer changed? Explain.
80.1 On the basis of what you know about meta-analysis, would you be interested in conducting one in the near future? At some later point in your professional career? Explain.
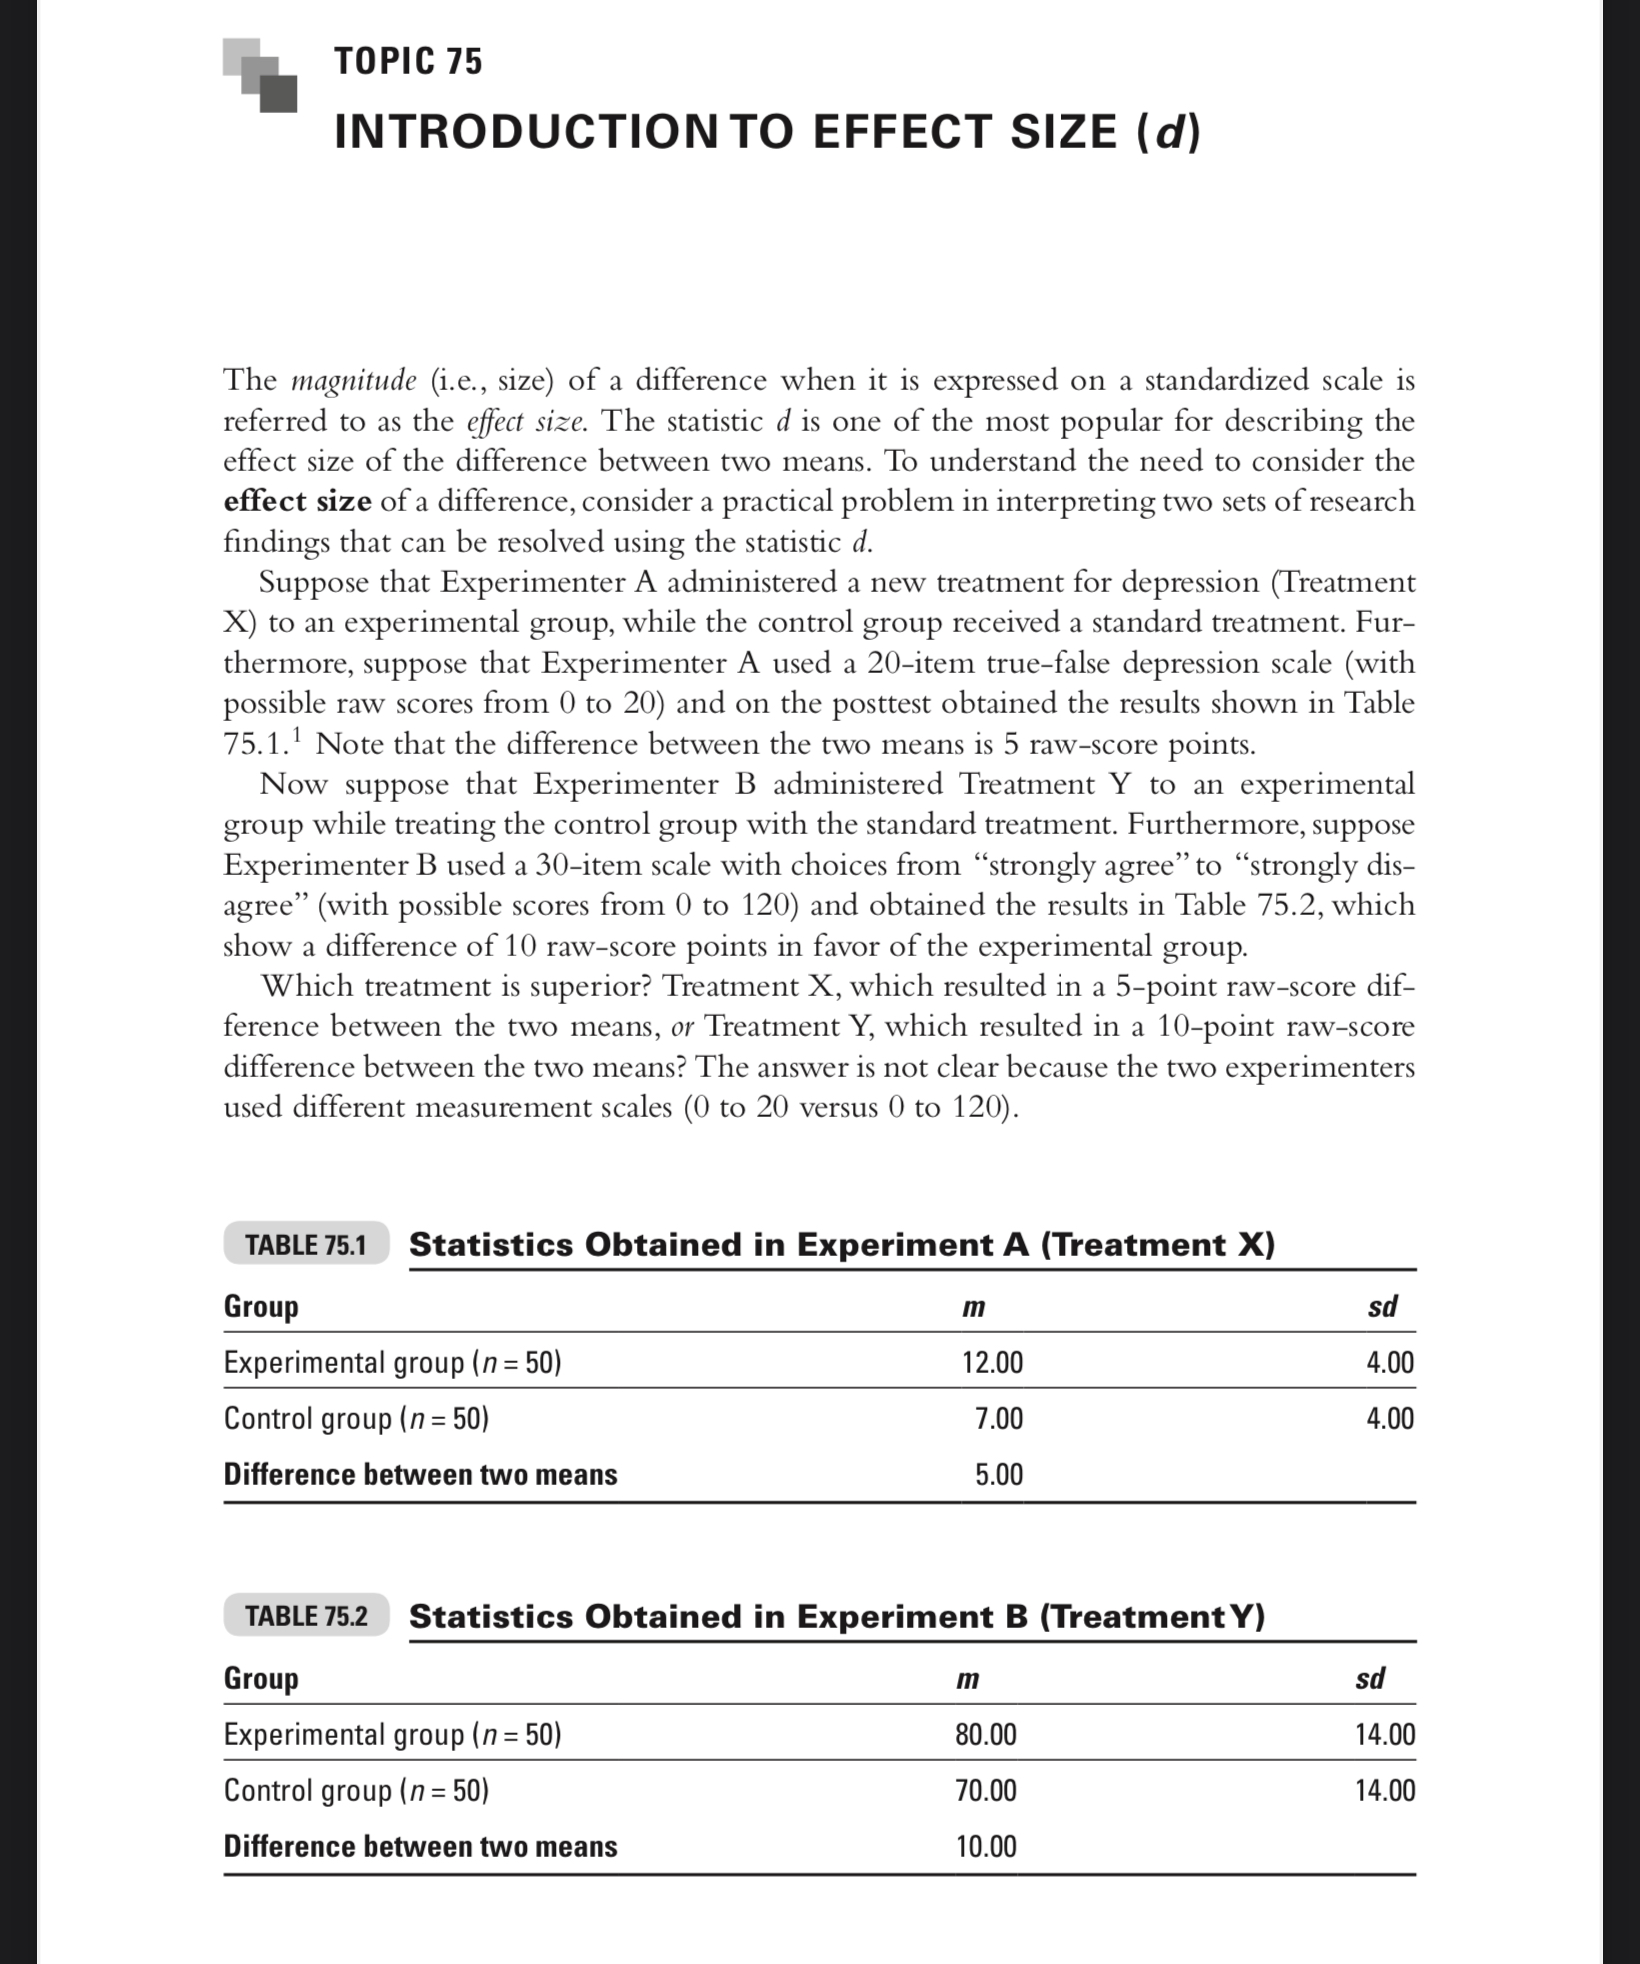
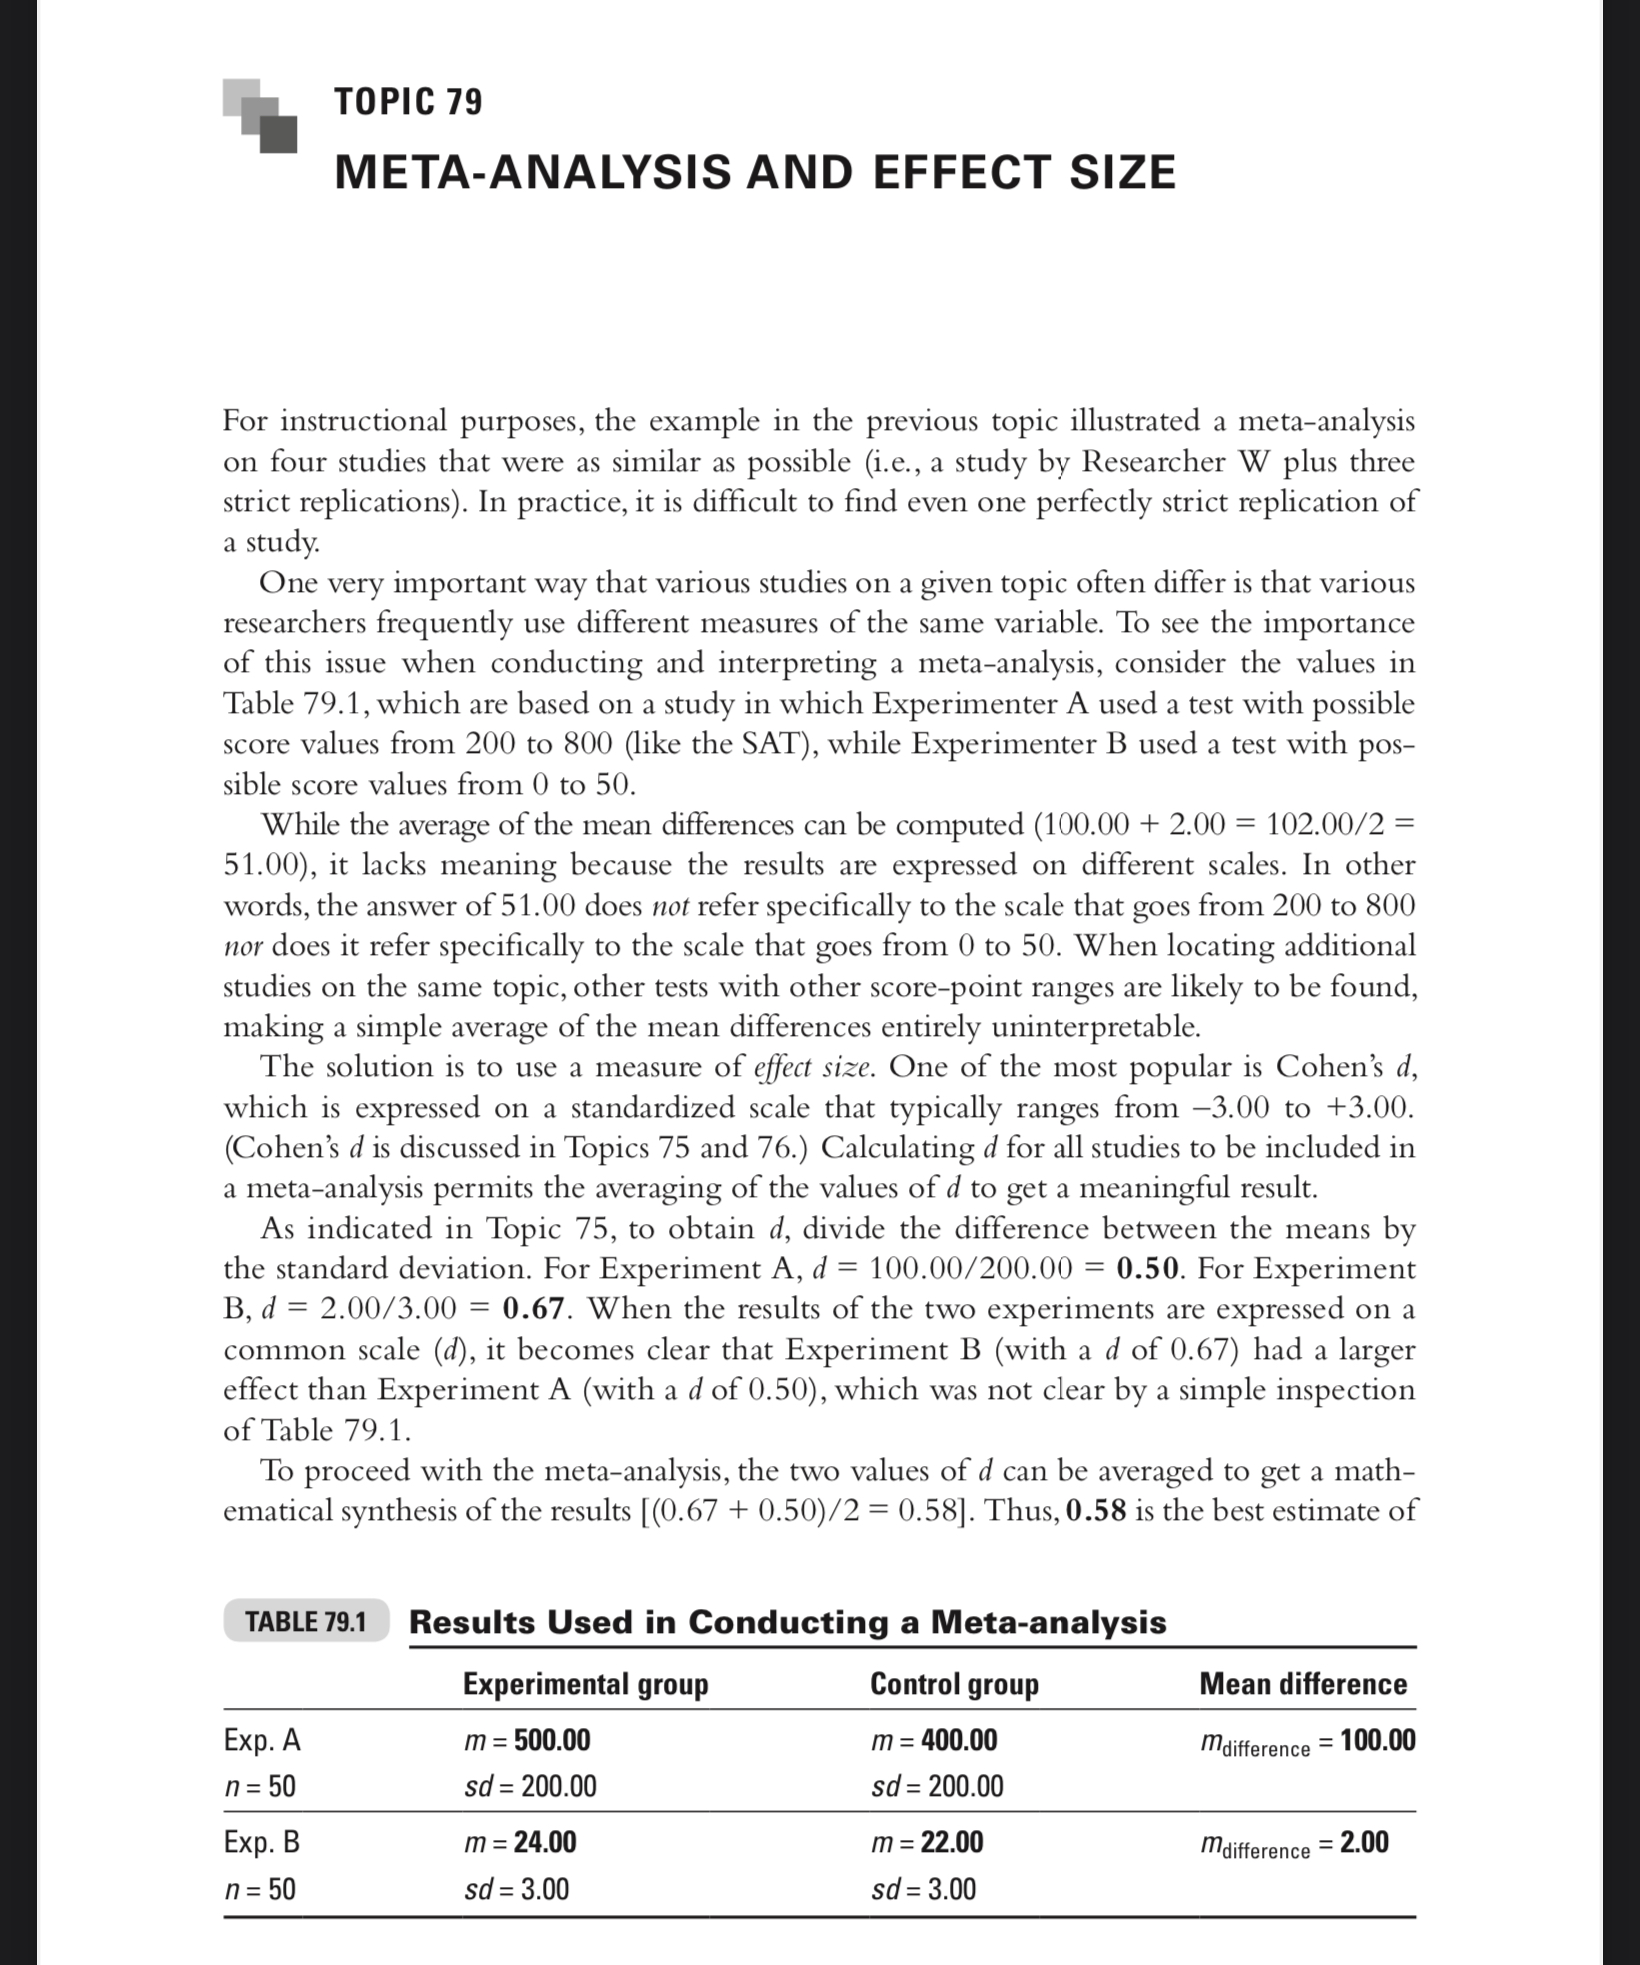
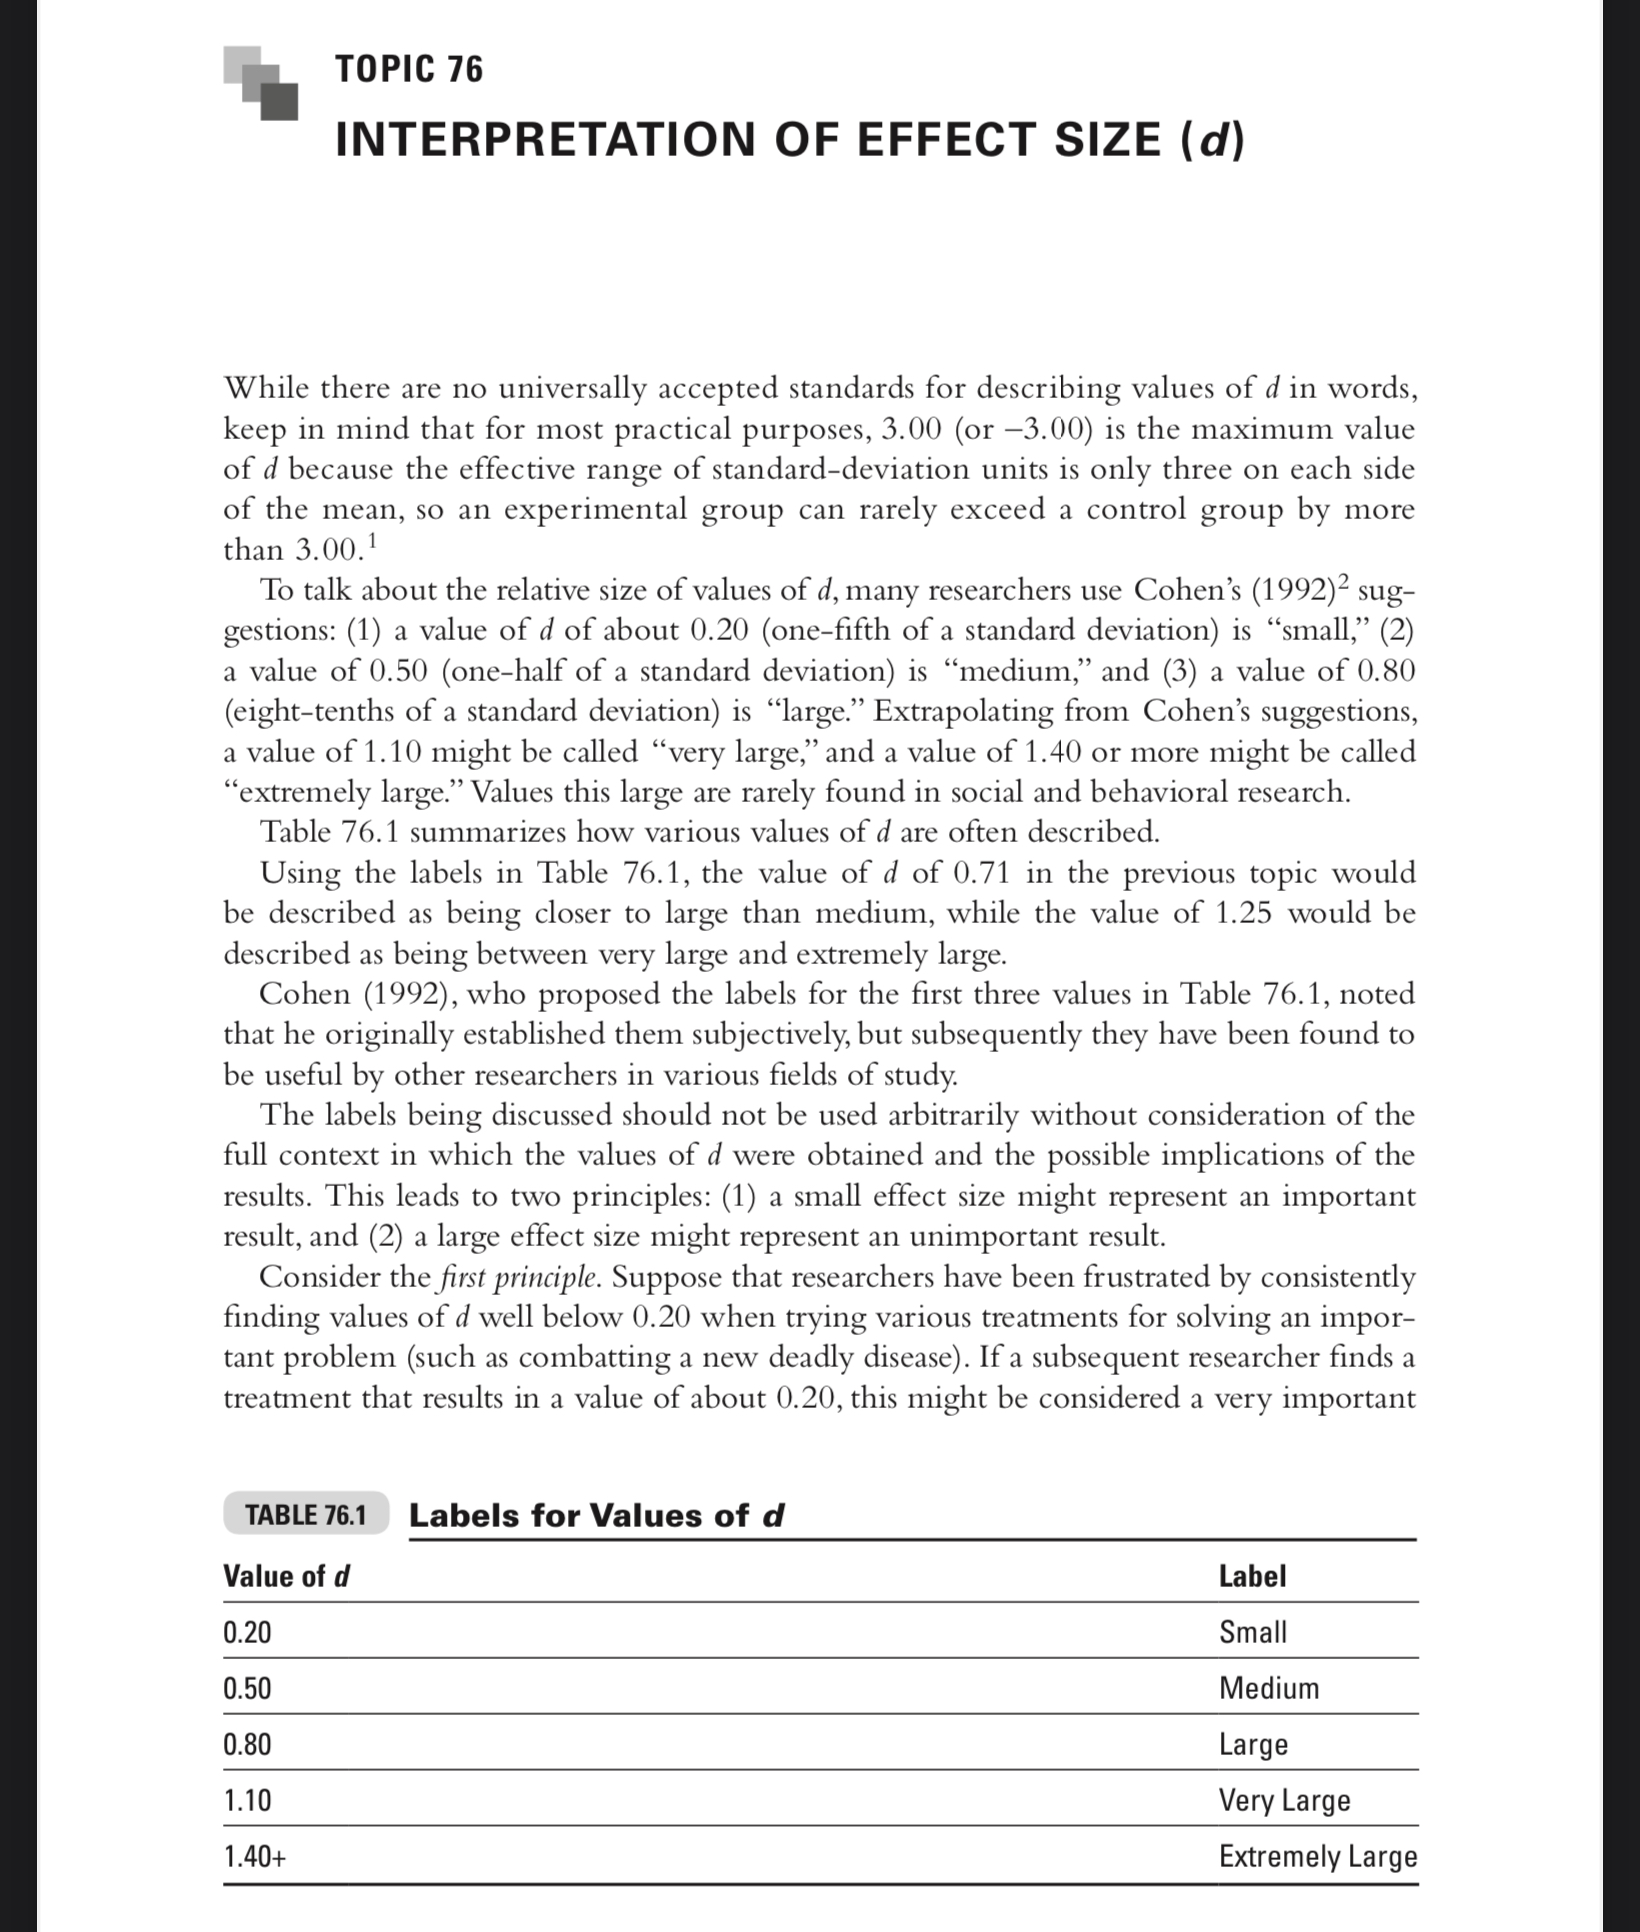
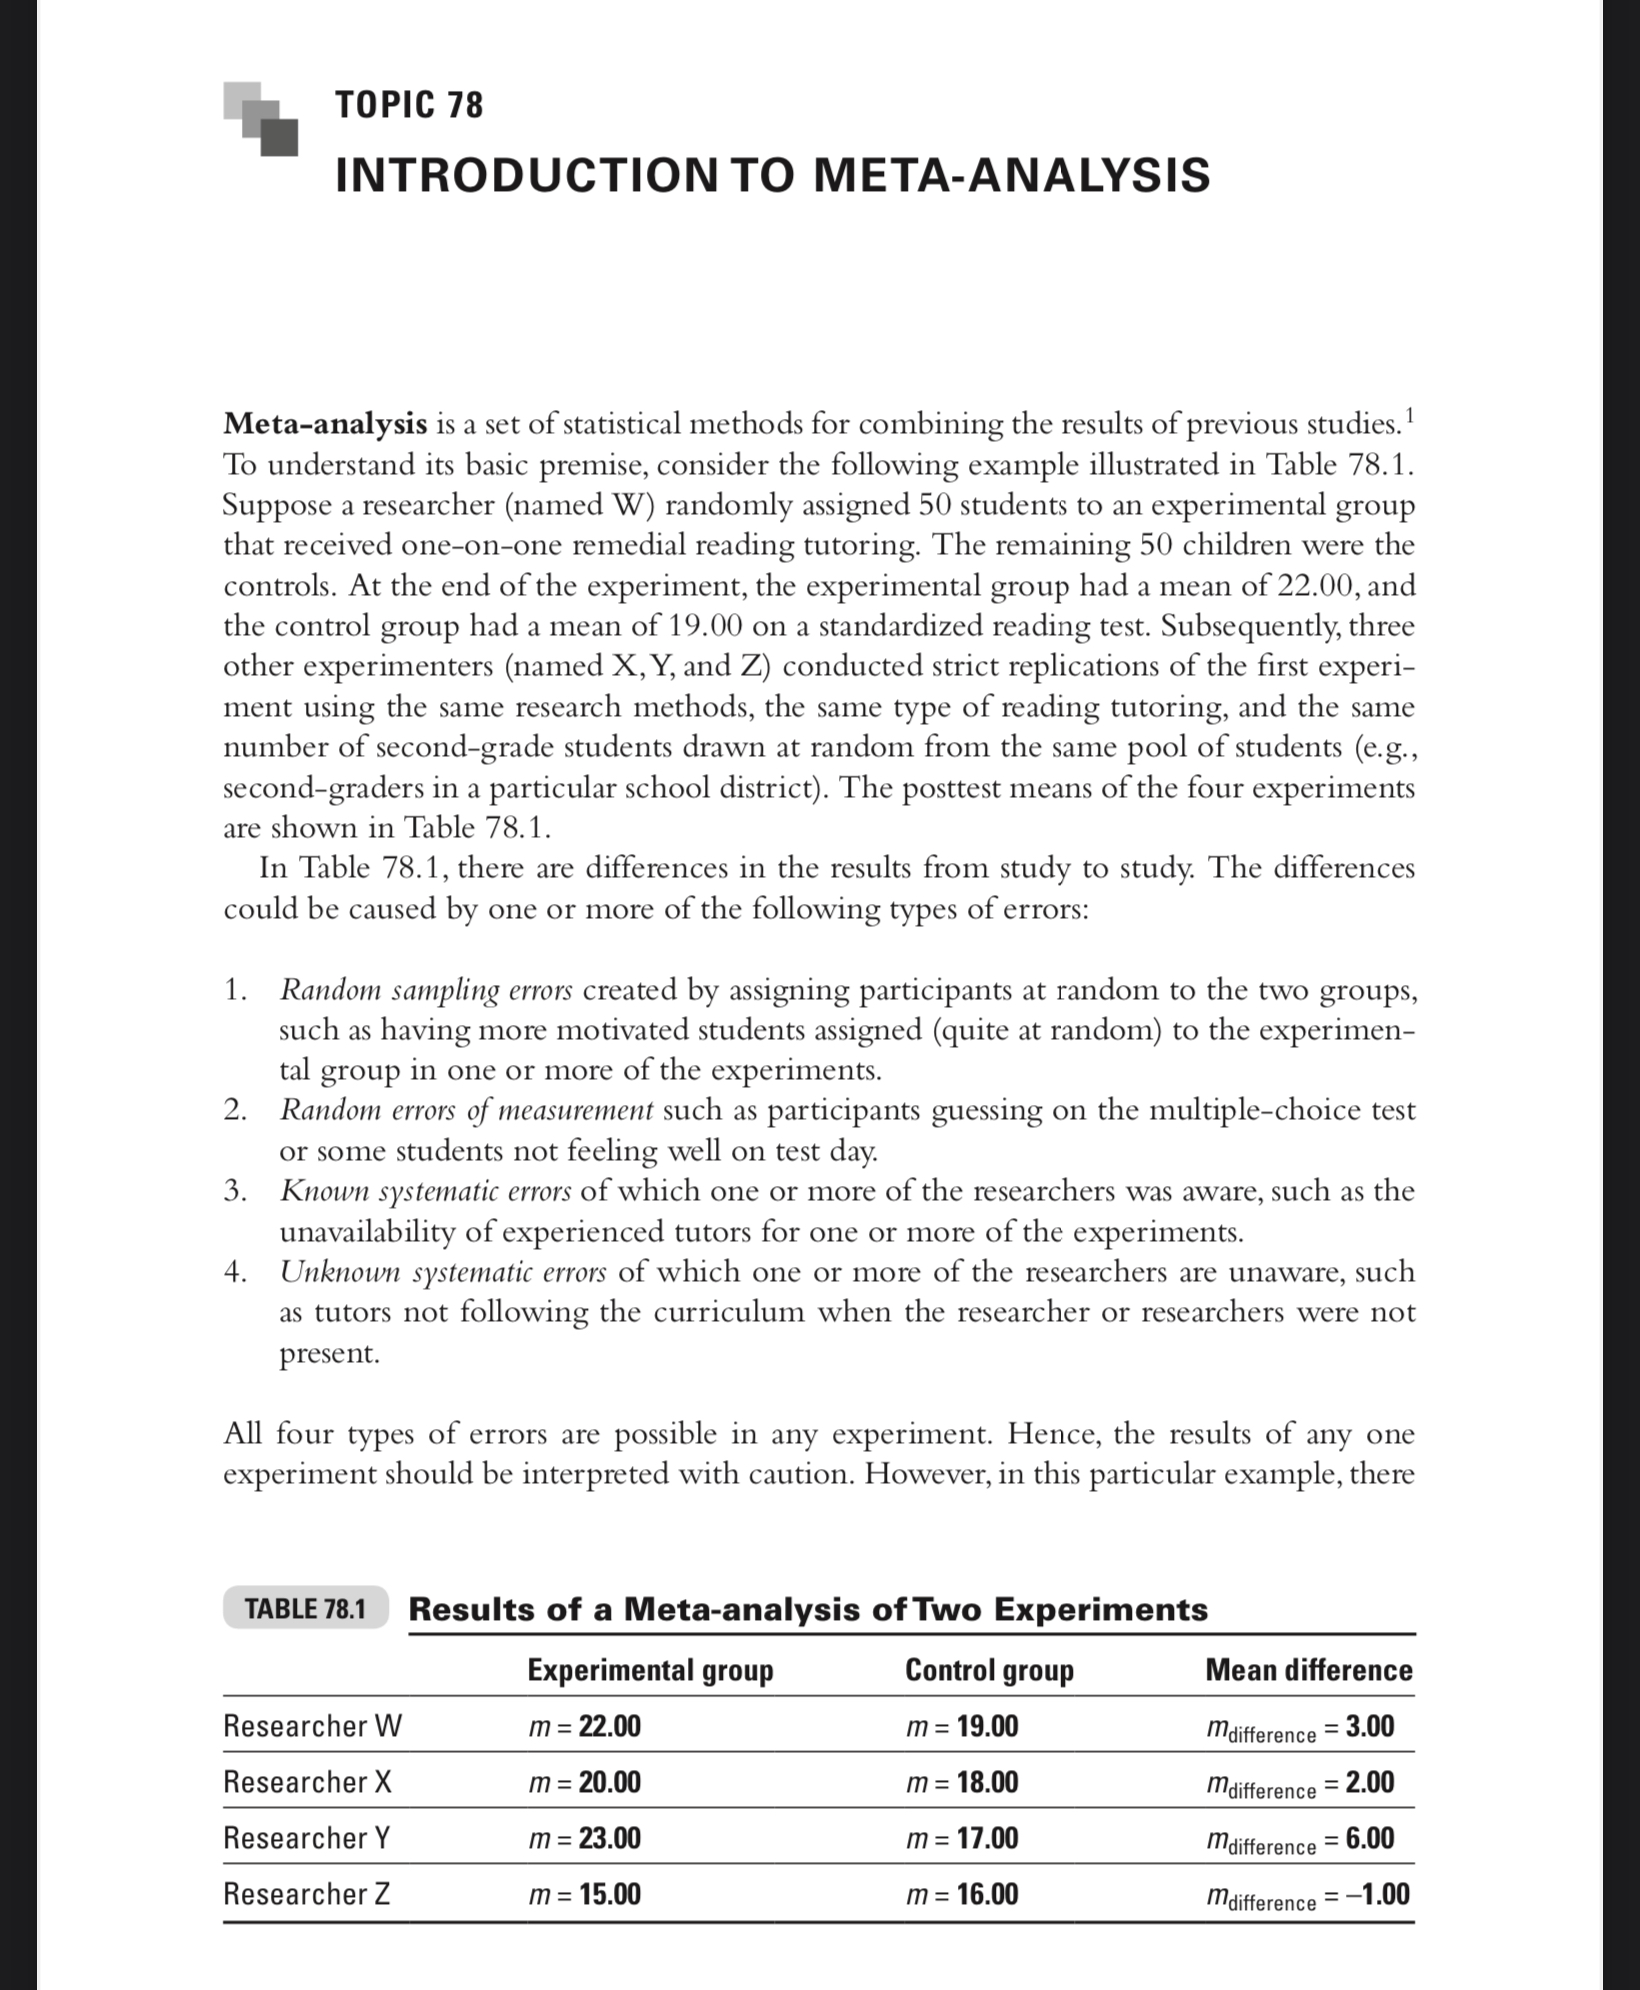
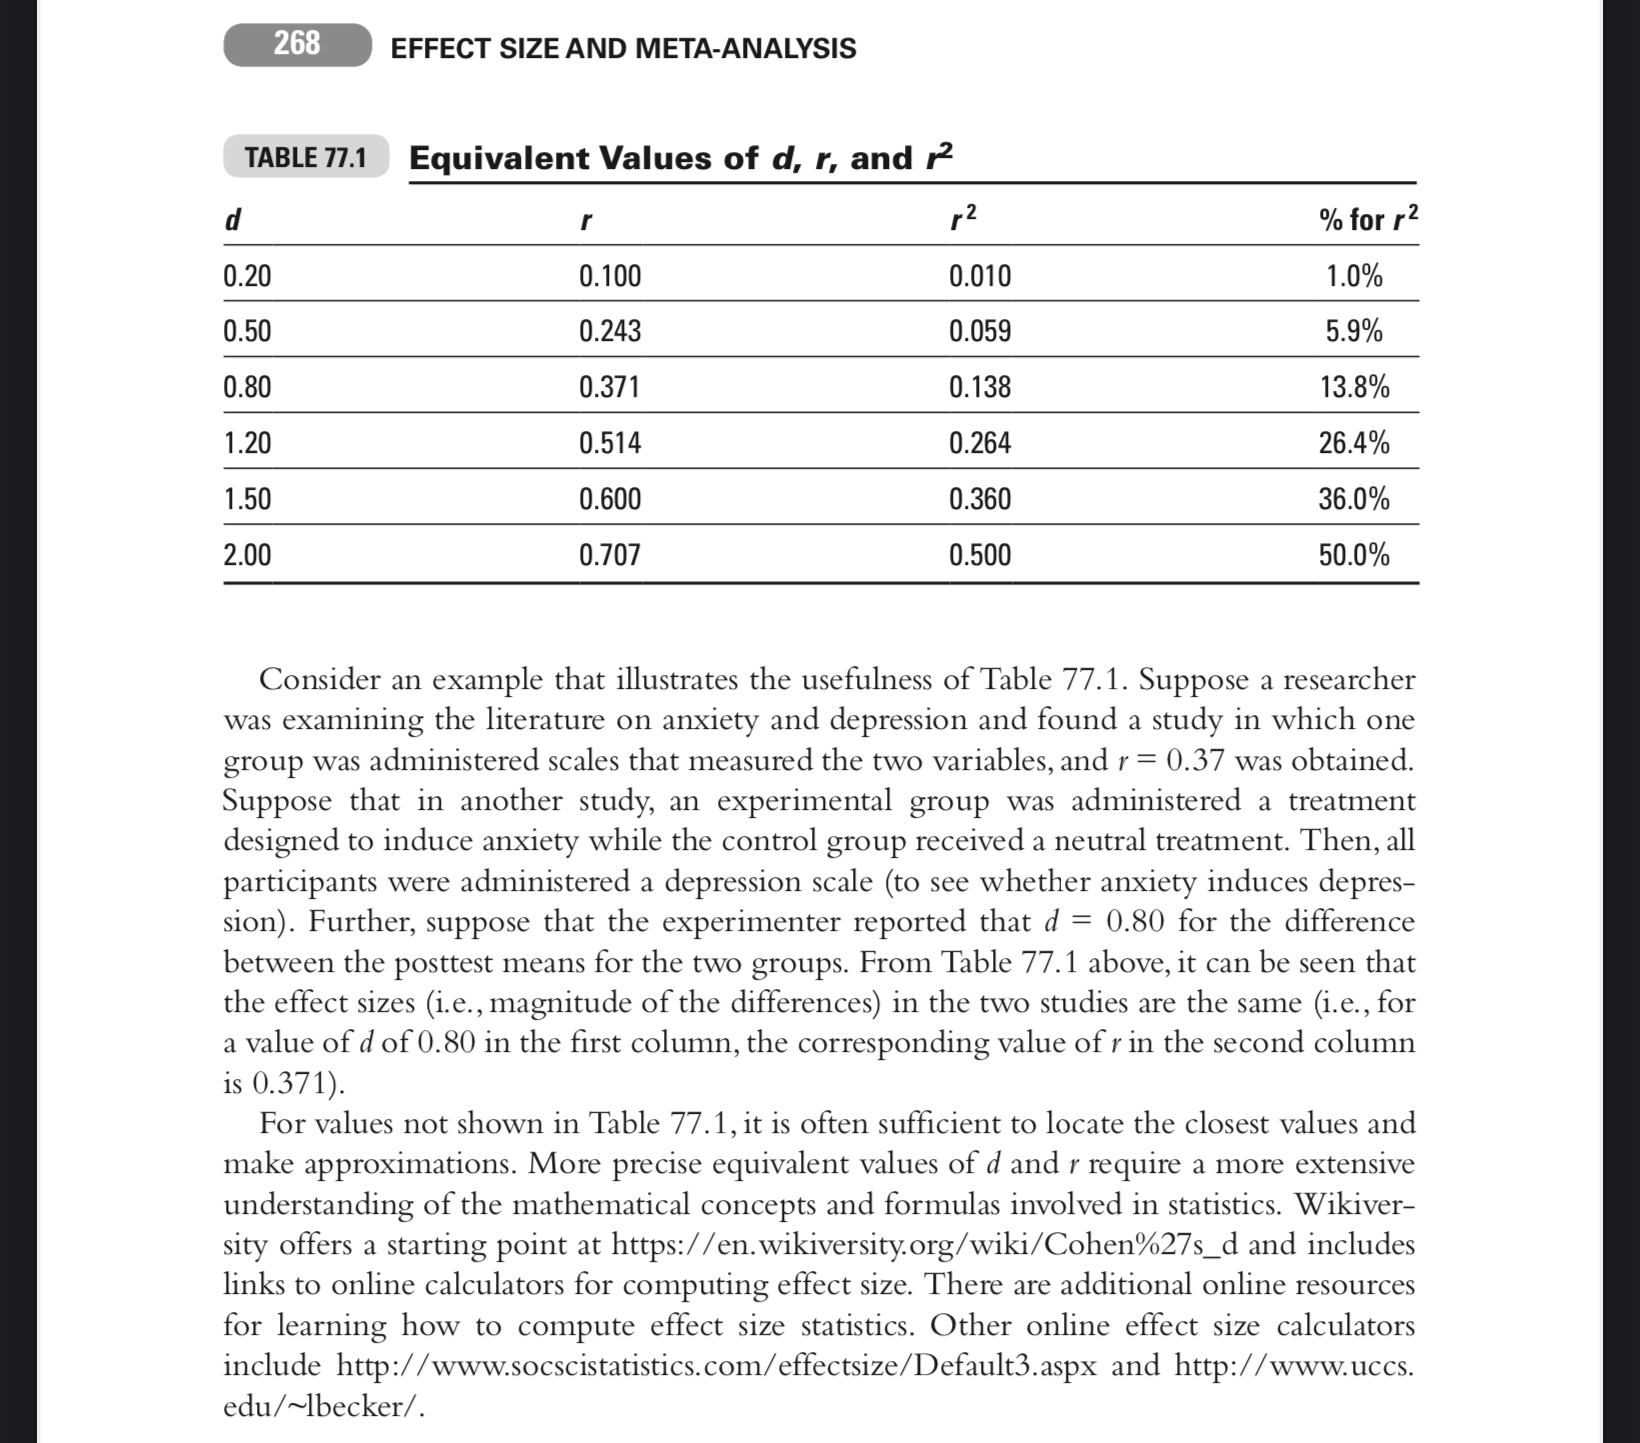
TOPIC 75 INTRODUCTION TO EFFECT SIZE (d) The nmgm'mdc (i.e., size) of a difference when it is expressed on a standardized scale is referred to as the {'i'fl size. The statistic d is one of the most popular for describing the effect size of the difference between two means. To understand the need to consider the effect size of a difference, consider a practical problem in interpreting two sets of research findings that can be resolved using the statistic (1. Suppose that Experimenter A administered a new treatment for depression (Treatment X) to an experimental group, while the control group received a standard treatment. Fur thermore, suppose that Experimenter A used a 20item true-false depression scale (with possible raw scores from 0 to 20) and on the posttest obtained the results shown in Table 75.1.1 Note that the difference between the two means is 5 rawscore points. Now suppose that Experimenter B administered Treatment Y to an experimental group while treating the control group with the standard treatment. Furthermore, suppose Experimenter 13 used a 30item scale with choices from \"strongly agree\" to \"strongly dis agree\" (with possible scores from U to 120) and obtained the results in Table 75.2, which show a difference of 10 rawscore points in favor of the experimental group. Which treatment is superior? Treatment X, which resulted in a 13-point rawscore dif- ference between the two means, or Treatment Y, which resulted in a 10point raw-score difference between the two means? The answer is not clear because the two experimenters used different measurement scales (0 to 20 versus 0 to 120). TABLE 15.1 Statistics Obtained in Experiment A (Treatment X) Group or 3:1 Experimental group lo: 50] 12.00 4.00 Control group (n = 50) 7.00 4.00 Difference between two means 5.00 TABLE 15.2 Statistics Obtained in Experiment B (TreatmentY) Group or sd Experimental group ln: 50] 80.00 14.00 Control group (n = 50) 70.00 14.00 Difference between two means 10.00 TOPIC 79 META-ANALYSIS AND EFFECT SIZE For instructional purposes, the example in the previous topic illustrated a metaanalysis on four studies that were as similar as possible (i.e., a study by Researcher W plus three strict replications). In practice, it is difficult to find even one perfectly strict replication of a study. One very important way that various studies on a given topic often differ is that various researchers frequently use different measures of the same variable. To see the importance of this issue when conducting and interpreting a meta-analysis, consider the values in Table 79.1, which are based on a study in which Experimenter A used a test with possible score values from 200 to 800 (like the SAT), while Experimenter B used a test with pos- sible score values from 0 to 50. While the average ofthe mean differences can be computed (100.00 + 2.00 : 102.00/2 : 51.00), it lacks meaning because the results are expressed on different scales. In other words, the answer of51.00 does not refer specifically to the scale that goes from 200 to 800 nor does it refer specically to the scale that goes from 0 to 50. When locating additional studies on the same topic, other tests with other score-point ranges are likely to be found, making a simple average of the mean differences entirely uninterpretable. The solution is to use a measure of gym size. One of the most popular is Cohen's d, which is expressed on a standardized scale that typically ranges from 3.00 to +3.00. (Cohen's (I is discussed in Topics 75 and 76.) Calculating d for all studies to be included in a metaanalysis permits the averaging of the values of d to get a meaningful result. As indicated in Topic 75, to obtain (1', divide the difference between the means by the standard deviation. For Experiment A, d : 100.00/200.00 : 0.50. For Experiment B, (1' : 2.00/3.00 : 0.67. When the results ofthe two experiments are expressed on a common scale (11'), it becomes clear that Experiment B (with a d of 0.67) had a larger effect than Experiment A (with a d of 0.50), which was not clear by a simple inspection of'Table 79.1. To proceed with the metaanalysis, the two values of (i can be averaged to get a math- ematical synthesis of the results [(0.67 + 0.50)/2 : 0.58]. Thus, 0.58 is the best estimate of TABLE 19.1 Results Used in Canducting a Meta-analysis Experimental group Control group Mean difference Exp. A m : 500.00 m = 400.00 mdierence = 100.00 n = 50 sd = 200.00 sd = 200.00 Exp. B m = 24.00 m = 22.00 mdmerence = 2.00 n = 50 30': 3.00 sd = 3.00 280 of 353 INTERPRETATION OF EFFECT SIZE (d) am finding. At this low level (0.20), the effect of the treatment is small, but it might be of immense importance to those ill individuals who would be helped by the treatment, however few. In addition, the results might point the scientific community in a fruitful direction for additional research. The second principle is that a large value of deven one above 1.40might be of limited importance. This is most likely when the results lack practical significance in terms of cost, public and political acceptability, or ethical and legal concerns (see Topic 74 for consider ations in determining the practical significance of research results). Here are three steps for interpreting the difference between two means. First, determine whether the difference is statistically signicant at an acceptable probability level, such as p
Step by Step Solution
There are 3 Steps involved in it

Get step-by-step solutions from verified subject matter experts