

Question: Efficient Frontier (EF): Use portfolio SD values (Q.4.B) (i.e. with actual correlation coefficient 1,2 = AAPL,AMZN ). Now you are going to draw a graph
Efficient Frontier (EF): Use portfolio SD values (Q.4.B) (i.e. with actual correlation coefficient 1,2=AAPL,AMZN). Now you are going to draw a graph that will be efficient frontier (EF) or minimum variance frontier. Use scattered plot with line, select Expected returns of portfolio, vertical axis: Expected portfolio returns (Q.4.A) and horizontal axis Q.4.B (portfolio SD values). This graph gives different combination of risk and return but investor is objectively looking for a combination that minimizes risk with possible highest return. Explain the minimum variance vs returns for variance values between minimum and highest value of SD vs return. [The best combination of risk and return for an investor to consider is known when we draw a constraint which will make tangent at a point on EF. Next part will draw the constraint. ]
Efficient Portfolio: You are going to calculate Sharpe Ratio (SR) (= (Expected portfolio return RF rate)/Portfolio SD). Use hypothetical weights (in addition to weights used in Q.4.C) 55% for AAPL and 45% for AMZN to calculate Expected portfolio return and portfolio SD in SR. Whereas, risk free rate RF is used that you calculated in Q.1 A. Now, you are finding a combination of weights such that SR is maximized. For this you need to use SOLVER in excel.
Go to top menu and select DATA and next select SOLVER. In solver, insert SR cell in Set Objective, insert first value of hypothetical weight (55%) (used in part B) in by changing variable cells, solve. The iteration calculation will solve for a specific weight that maximums the portfolio SR ratio. This will give you portfolio return and SD. Collect the following values: RF rate (used in part B), portfolio return and SD, SD of RFR and correlation between RF and portfolio return (equals zero).
Use portfolio return and portfolio SD which is obtained through Solver that maximized SR. Now use weight from 100% - 0% to -160% and 60% to create portfolio return (AAPL, RFR) and portfolio SD (AAPL, RFR). This will construct the Capital Market Line (CML). In the next part, CML will be make tangent to EF.
Go to the graph that you have drawn in part A. Add series that you created in part D. This will make tangent to the EF. Interpret the tangency point i.e. the efficient portfolio.
Data for this question
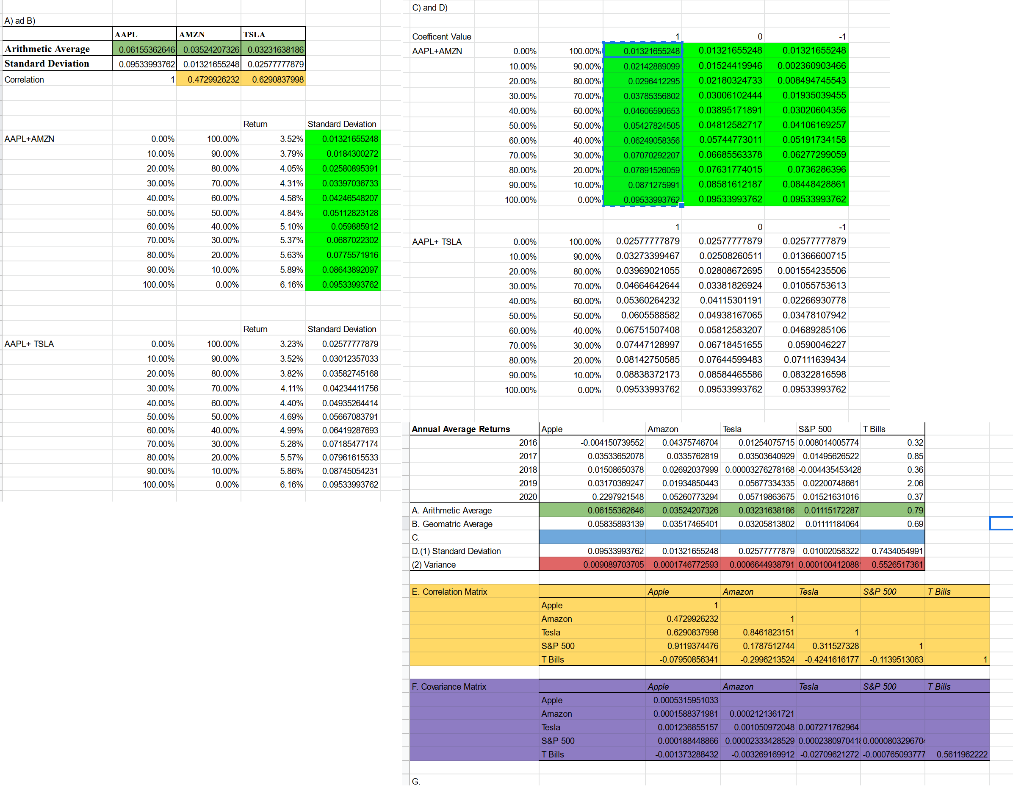
A) ad B) \begin{tabular}{|l|l|l|l|} \hline & AAPI. & AMZN & TK1.A \\ \hline Arithmetic Arerage & 0.06156362646 & 0.03524207326 & 0.03231638186 \\ \hline Standard Deviation & 0.09533593762 & 0.01321855248 & 0.02577777879 \\ \hline Correlation & 1 & 0.4720926232 & 0.6200937908 \\ \hline \end{tabular} C and D ? A) ad B) \begin{tabular}{|l|l|l|l|} \hline & AAPI. & AMZN & TK1.A \\ \hline Arithmetic Arerage & 0.06156362646 & 0.03524207326 & 0.03231638186 \\ \hline Standard Deviation & 0.09533593762 & 0.01321855248 & 0.02577777879 \\ \hline Correlation & 1 & 0.4720926232 & 0.6200937908 \\ \hline \end{tabular} C and D
Step by Step Solution
There are 3 Steps involved in it

Get step-by-step solutions from verified subject matter experts