

Question: Egypt Country Data Analysis Writing Assignment: Step 3 - Essay Instructions Use the information in the Country Data File to write a 700-1000 wordessay examining
Egypt Country Data Analysis Writing Assignment: Step 3 - Essay Instructions
Use the information in the Country Data File to write a 700-1000 wordessay examining the relationship between GDP per capita and the standard of living in your country.
This is a summative assessment to evaluate what you learned from the Real GDP per Capita & the Standard of Living module. Your analysis should reflect the content covered in the textbook and posted to Canvas.
Use the outline and prompts below to help guide and organize your thinking. You are encouraged to formulate other questions in addition to those listed.
Suggested Structure of the Essay
Paragraph 1: Introduction
? Introduce your country and tell the reader what the essay is about.
Paragraph 2: Income and Population
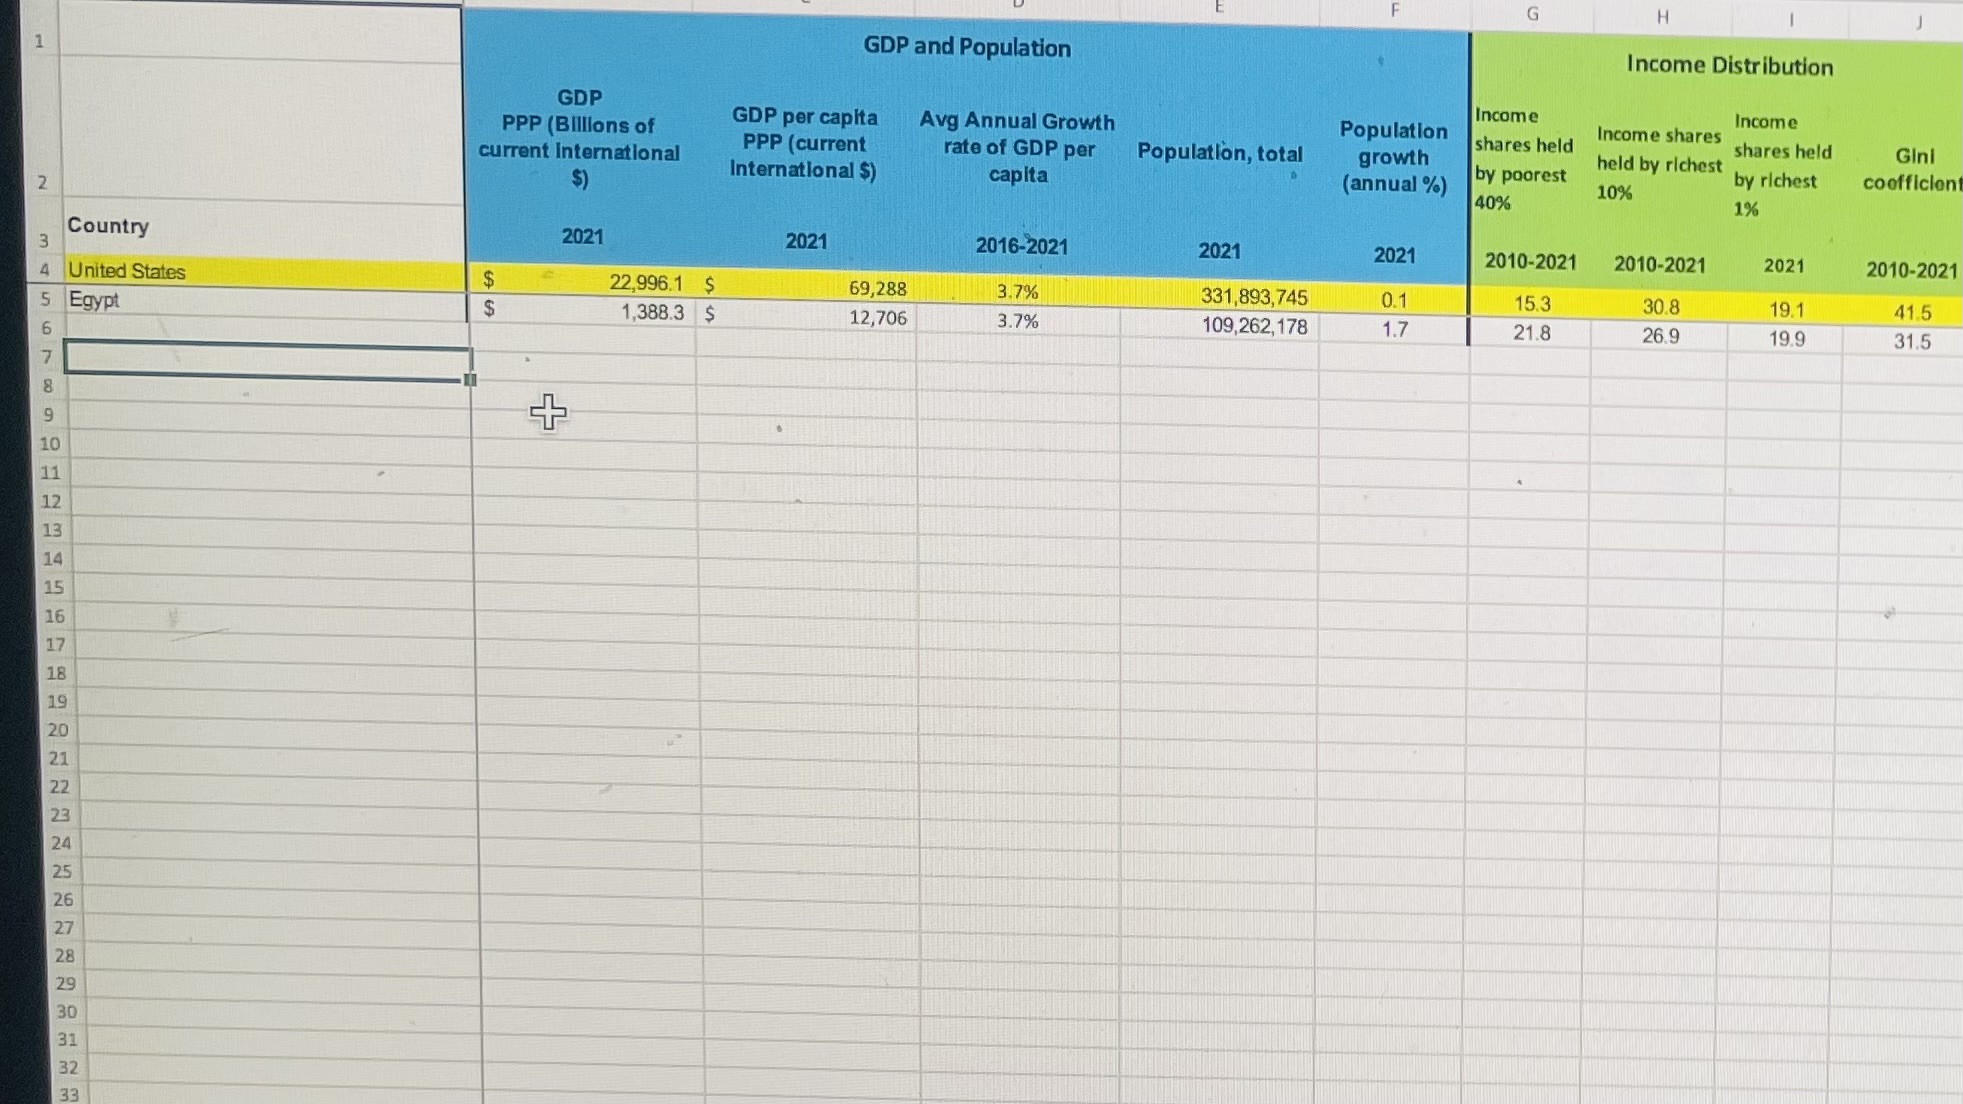
? Demonstrate you understand the relationship between the levels of real GDP, population, and real GDP per capita.o Does a country with a relatively large/small population have a relatively high/low real GDP? o Does a country with a relatively large/small population have a relatively low/high real GDP per capita? o Does a country with a relatively large/small real GDP have a relatively high/low real GDP per capita? ? Demonstrate you understand the relationship between the growth rates of real GDP, population, and real GDP per capita.o happens to real GDP per capita in a country with a rapidly growing population? o What happens to real GDP per capita in a country if the population is stagnant or shrinking?
Paragraph 3: Income Distribution
? Demonstrate you understand the difference between the average income (as measured by GDP per capita) and the distribution of income and why this matters for the standard of living.? Within countryo Is income inequality a problem in your country? How does this change the interpretation of the GDP per capita (average income)? o Report and interpret the ratio of the income shares held by the richest 1% and 10% to the income share held by the poorest 40%.Explain what these ratios reveal about the distribution of income in your country as compared to the US.: o What is the average income of those in the poorest 40% of the population? The richest 10% of the population? The richest 1% of the population? How does these figures compare with the GDP per capita (average income for the entire population)?o What happens to real GDP per capita if you have a small group of very high earners in the country? ? Cross-country: o Compare the average income, the 40% / 10% / 1% income shares, the ratio of income shares, and the Gini coefficients for your country to the US. Are there any significant differences in the income distribution and/or inequality between your country and the US? ? Use this formula to compute the average income within each income groups:
Example:
Paragraph 4: Health and Education Outcomes
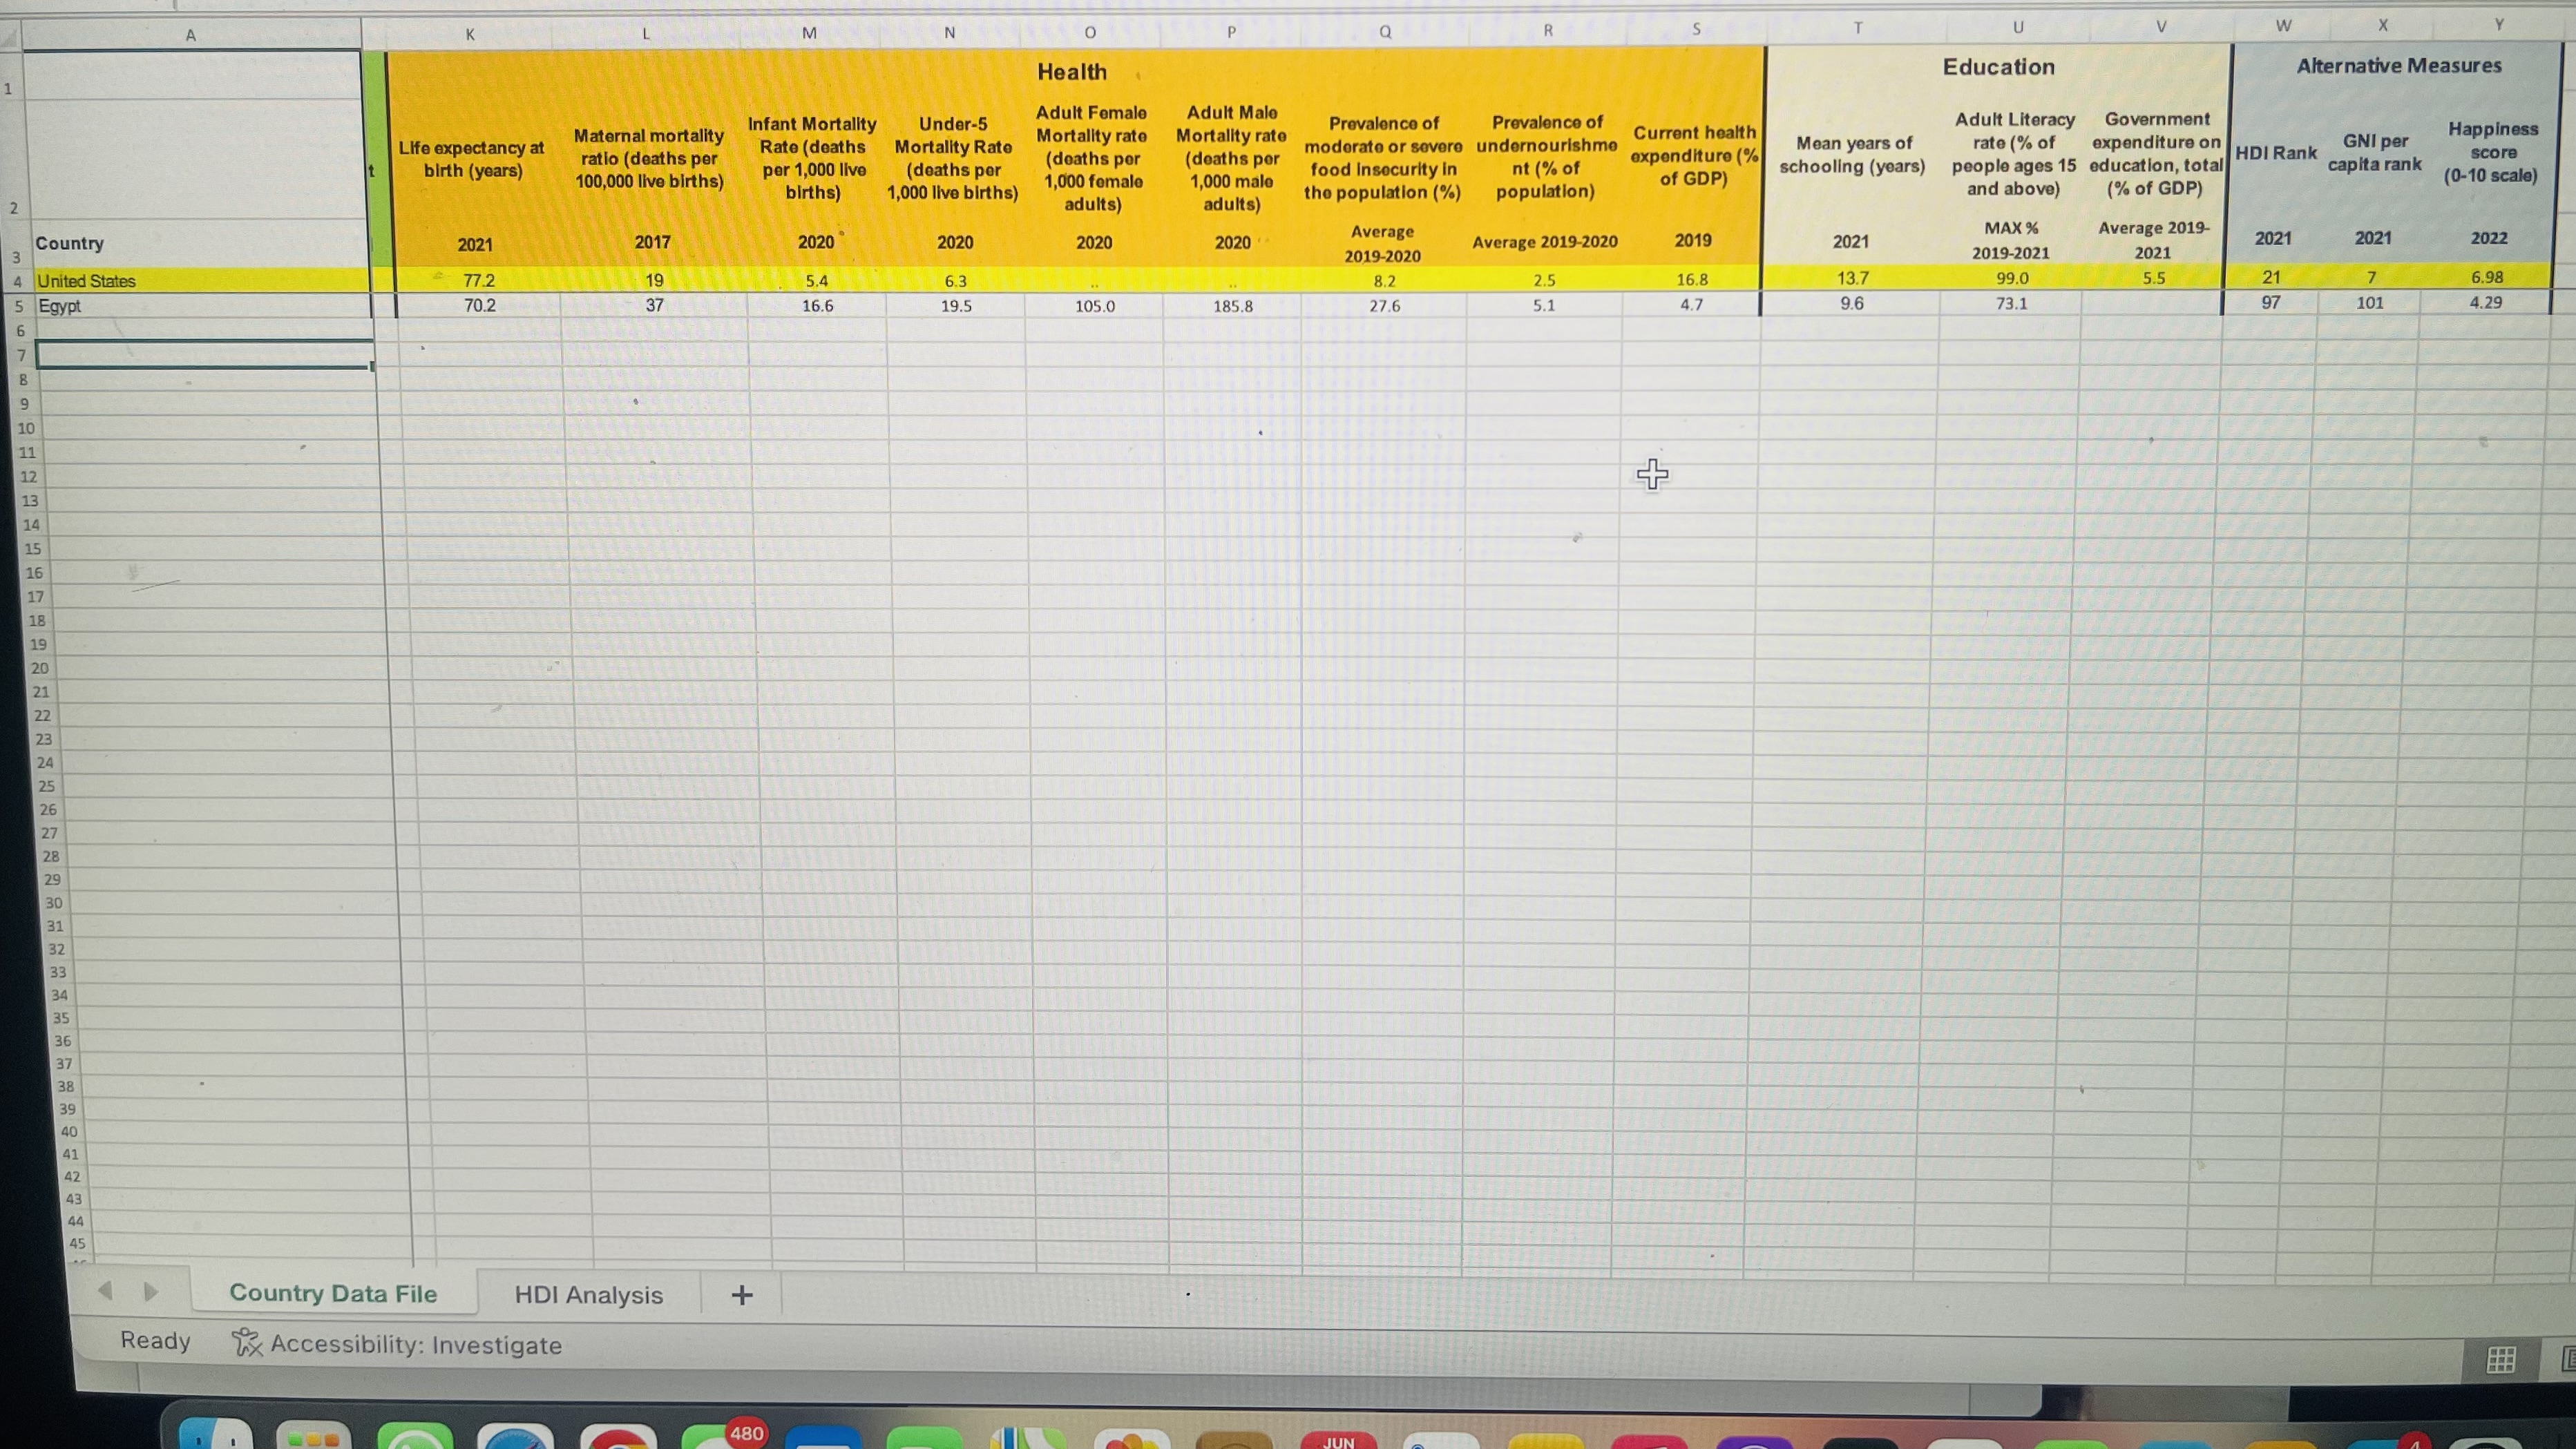
? Demonstrate you understand the relationship between GDP per capita and health and education outcomes.o Examine the health and education outcomes in your country as compared to the US.o Examine the spending on health and education as a % of GDP in your country as compared to the US. o Are health and education correlated with income per capita?
Paragraph 5: Alternative Measures of Standard of Living
? Demonstrate you understand the purpose and meaning of the Human Development Index (HDI) as an alternative measure of the standard of living.o Within country: Is your country ranked similarly in terms of GNI per capita and Human Development? If no, why do the rankings differ? Interpret what it means for the country to be ranked higher/lower in these two measures. o Cross country: Examine the countries sorted by HDI (Columns A-G of the HDI Analysis spreadsheet). Compare the results for the countries ranked immediately above/below your country in terms of HDI. What can you conclude about the relationship between income per capita and HDI?? Demonstrate you understand the purpose and meaning of the Happiness Score as an alternative measure of the standard of living.o Examine the countries sorted by Happiness Score (Columns I-O of the HDI Analysis spreadsheet). Compare the results for the countries ranked immediately above/below your country in terms of happiness. What can you conclude about the relationship between income per capita and happiness?? Examine the countries sorted by GDP per capita (Columns Q-W of the HDI Analysis spreadsheet). Compare the results for the countries ranked immediately above/below your country in terms of GDP per Capita. What can you conclude about the relationship between income per capita and these other measures of the standard of living?
Paragraph 6: Conclusion
? Summarize your analysis of the standard of living for your country. ? What do you conclude? Is real GDP per capita a good measure of the standard of living?
 G H GDP and Population Income Distribution 1 GDP Income Income GDP per capita Avg Annual Growth Population Income shares PPP (Billions of shares held shares held Gini PPP (current rate of GDP per Population, total growth current International by poorest held by richest by richest coofficion International $) capita (annual %) 10% $) 10% 1% 2 Country 2021 2021 2016-2021 2021 2021 2010-2021 2010-2021 2021 2010-2021 United States $ 22,996.1 $ 69,288 3.7% 331,893,745 0.1 15.3 30.8 19.1 41.5 5 Egypt $ 1,388.3 $ 12,706 3.7% 109,262, 178 1.7 21.8 26.9 19.9 31.5 11 12 14 15 16 17 18 19 20 21 22 23 24 25 26 27 28 29 30 31 32 33W M N 0 Q R Health Education Alternative Measures Adult Female Adult Male Maternal mortality Infant Mortality Under-5 Prevalence of Government Mortality rate Prevalence of Adult Literacy Mortality rate Current health Happiness Life expectancy at Rate (deaths Mortality Rate moderate or severe undernourishme Mean years of rate (% of expenditure on H GNI per ( deaths per score ratio (deaths per (deaths per expenditure (% food insecurity in nt (% of schooling (years) people ages 15 education, total HDI Rank capita rank birth (years) (deaths per (0-10 scale) 100,000 live births) per 1,000 live 1,000 female 1,000 male of GDP) births) 1,000 live births) adults) the population (%) population) and above) (% of GDP) adults) MAX % Average 2019- 2022 Country 2021 2017 2020 2020 2020 2020 Average Average 2019-2020 2019 2021 2021 2021 2019-2021 2021 3 2019-2020 United States 77.2 5.4 8.2 2.5 16.8 13.7 99.0 5.5 21 19 6.3 6.98 37 97 70.2 16.6 19.5 105.0 185.8 27.6 5.1 4.7 9.6 73.1 101 4.29 5 Egypt + Country Data File HDI Analysis + Ready TX Accessibility: Investigate 480
Step by Step Solution
There are 3 Steps involved in it

Get step-by-step solutions from verified subject matter experts