

Question: Eight experiments were defined as follows: Experiment Carbon Content (wt% C) 1 2 3 4 5 6 7 8 2 3 4 5 1
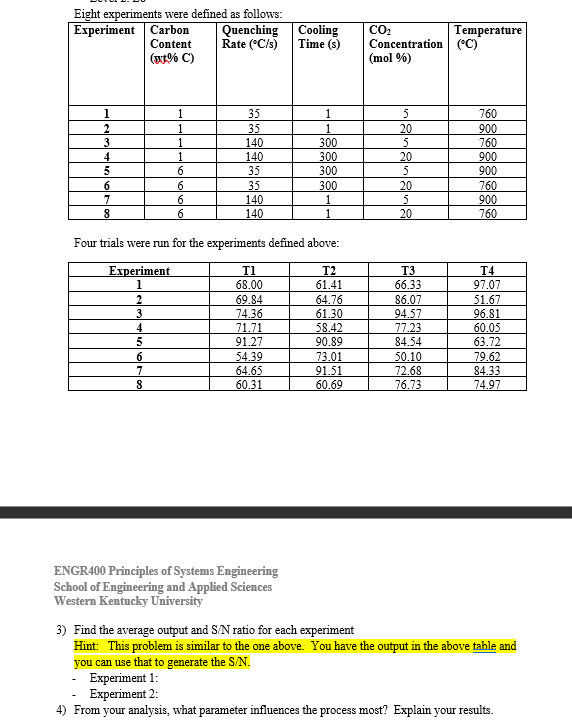
Eight experiments were defined as follows: Experiment Carbon Content (wt% C) 1 2 3 4 5 6 7 8 2 3 4 5 1 1 1 6 7 8 6 6 6 6 Quenching Rate (C/s) 35 35 140 140 35 35 140 140 Four trials were run for the experiments defined above: Experiment T2 1 61.41 T1 68.00 69.84 74.36 71.71 91.27 54.39 64.65 60.31 Cooling Time (s) ENGR400 Principles of Systems Engineering School of Engineering and Applied Sciences Western Kentucky University 1 1 300 300 300 300 1 1 64.76 61.30 58.42 90.89 73.01 91.51 60.69 CO Concentration (C) (mol %) 5 20 5 20 5 20 5 20 T3 66.33 86.07 94.57 77.23 84.54 Temperature 50.10 72.68 76.73 760 900 760 900 900 760 900 760 T4 97.07 51.67 96.81 60.05 63.72 79.62 84.33 74.97 3) Find the average output and S/N ratio for each experiment Hint: This problem is similar to the one above. You have the output in the above table and you can use that to generate the S/N. Experiment 1: Experiment 2: 4) From your analysis, what parameter influences the process most? Explain your results.
Step by Step Solution
There are 3 Steps involved in it
Experiment Carbon Content Quenching Rate Cs Cooling Time s CO2 Concentration mol Temperature C Avera... View full answer

Get step-by-step solutions from verified subject matter experts