

Question: Electric Circuits MSE 2 5 0 7 . The oscillogram shown in Figure Q 7 ( a ) was obtained while analyzing the circuit in
Electric Circuits
MSE
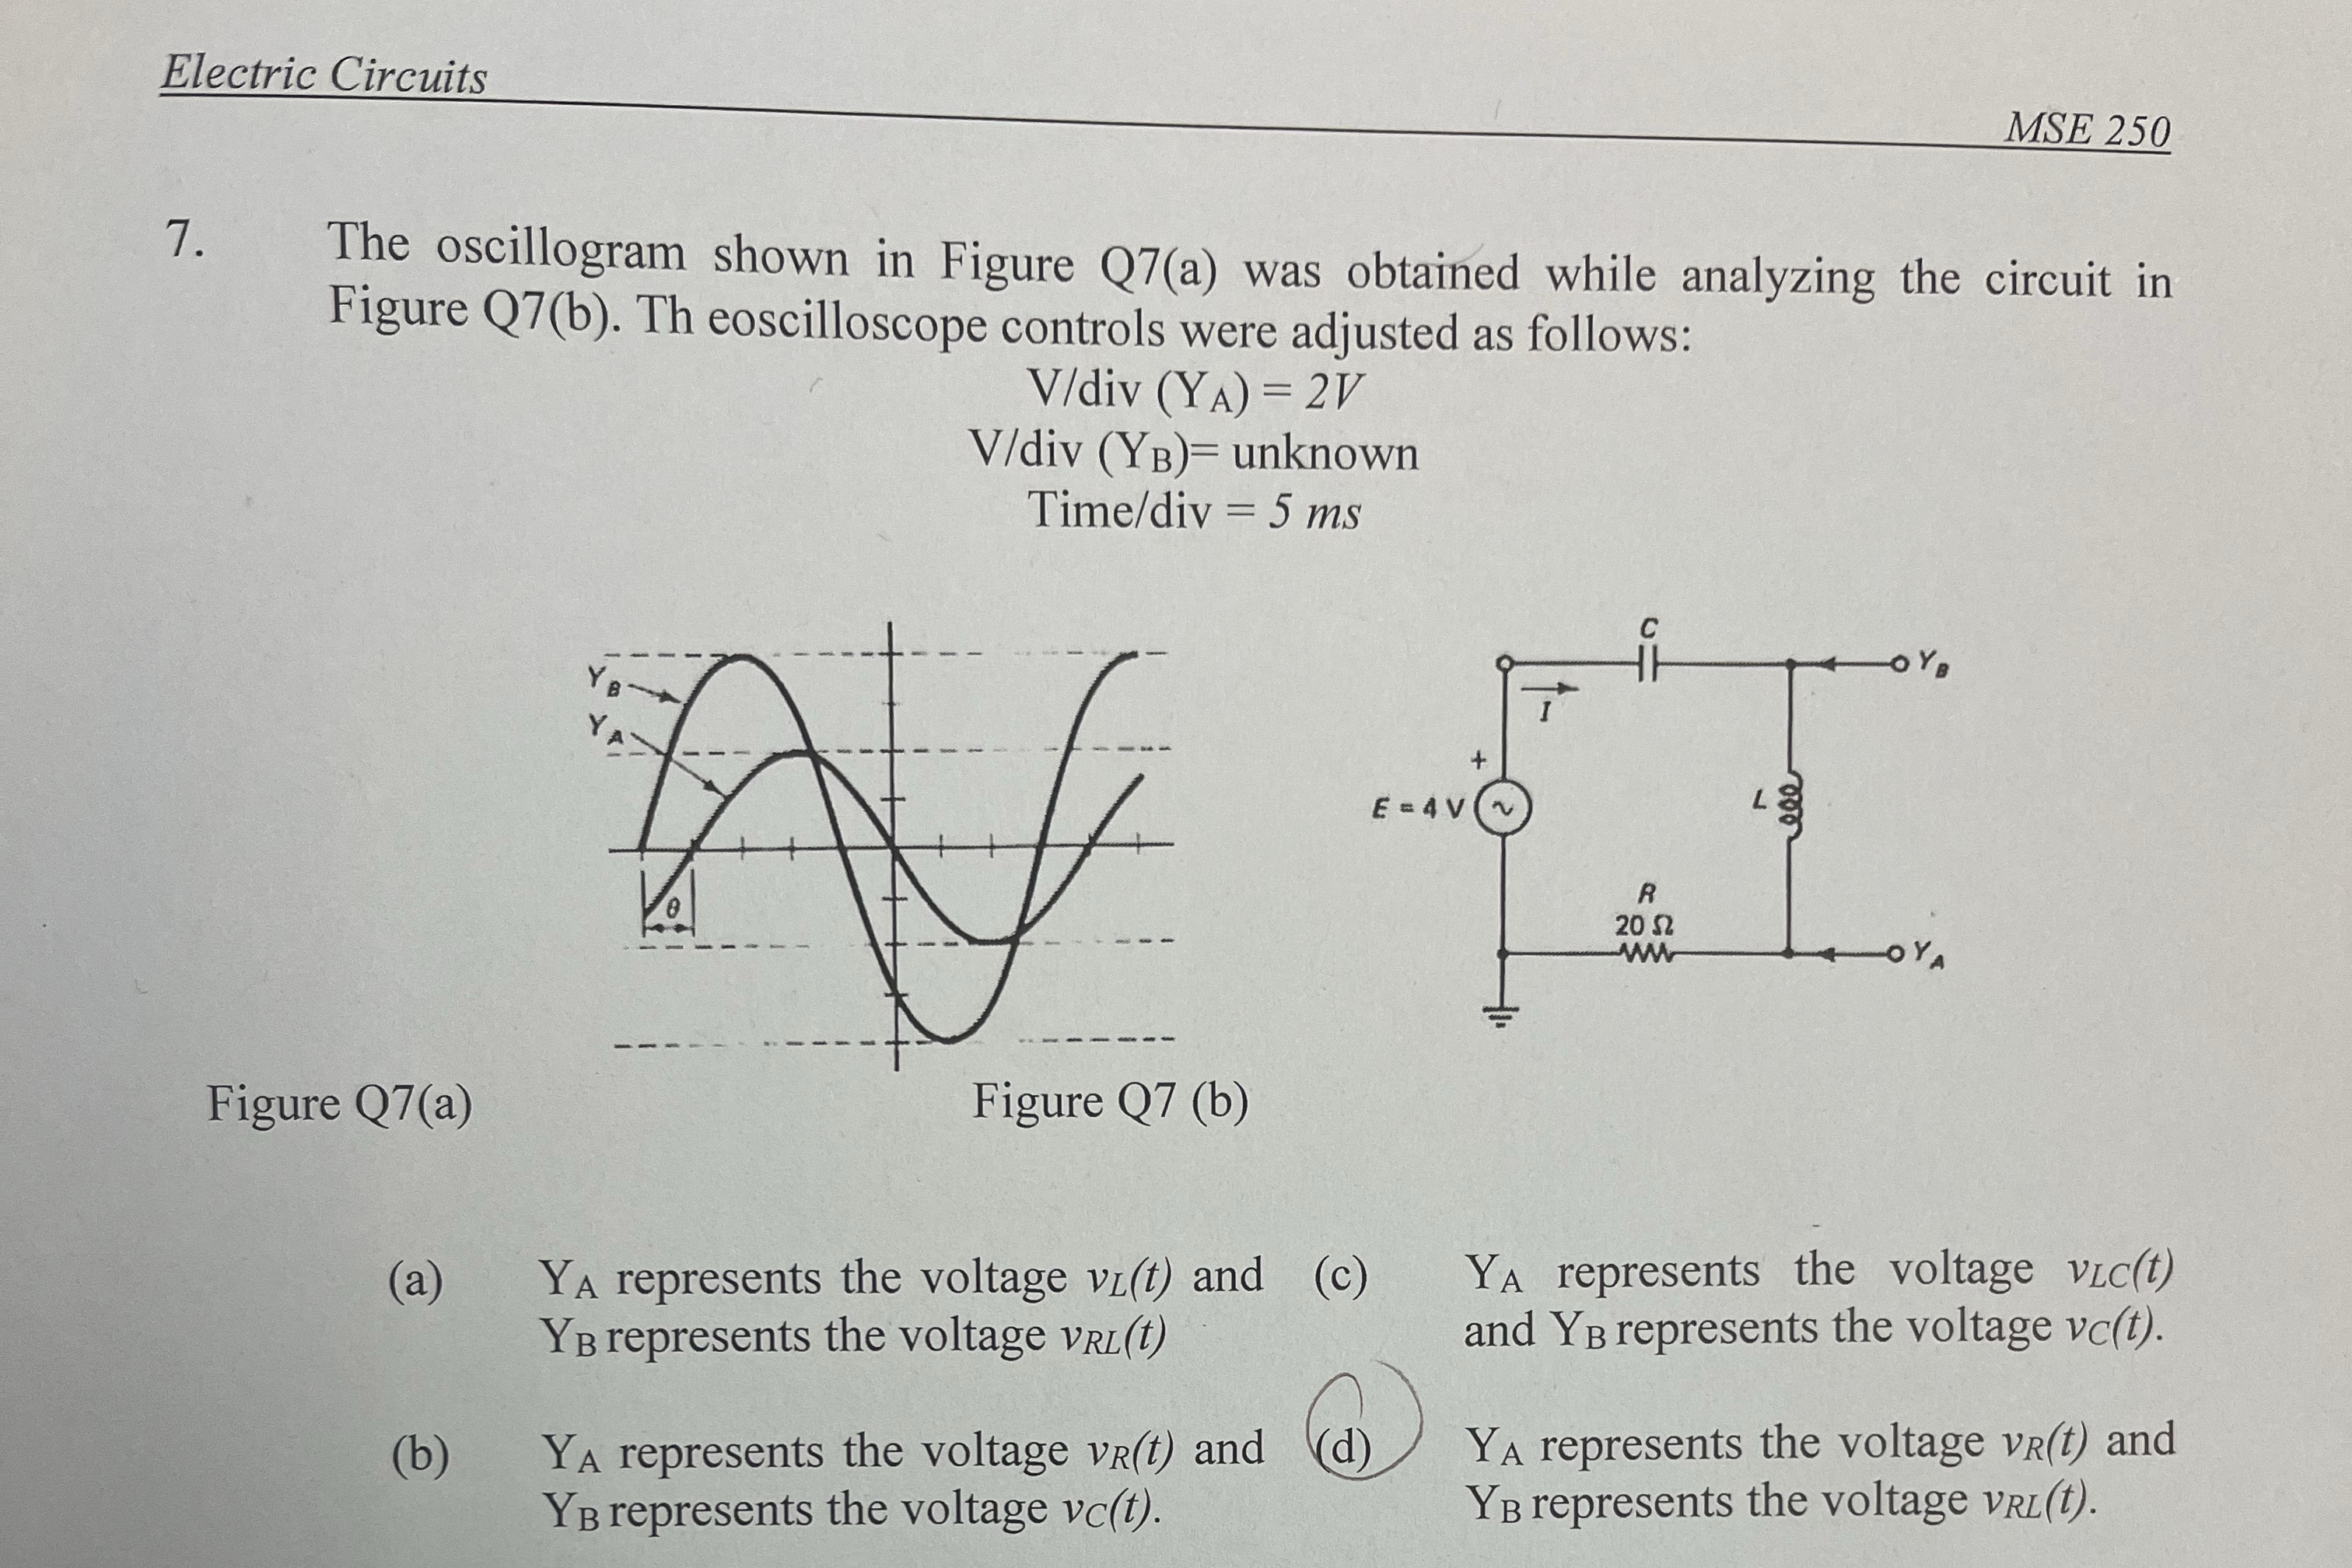
The oscillogram shown in Figure Qa was obtained while analyzing the circuit in Figure Qb Th eoscilloscope controls were adjusted as follows:
unknown
Time div
Figure Qa b
a represents the voltage and
c represents the voltage represents the voltage and represents the voltage
b represents the voltage and
d represents the voltage
Step by Step Solution
There are 3 Steps involved in it
1 Expert Approved Answer
Step: 1 Unlock

Question Has Been Solved by an Expert!
Get step-by-step solutions from verified subject matter experts
Step: 2 Unlock
Step: 3 Unlock