

Question: Elementary Statistics Quiz 3A Sections P.1 and 4.1 Software output is not required for this assignment. (Problems 1-2) Taxes and Soda Consumption - Suppose that
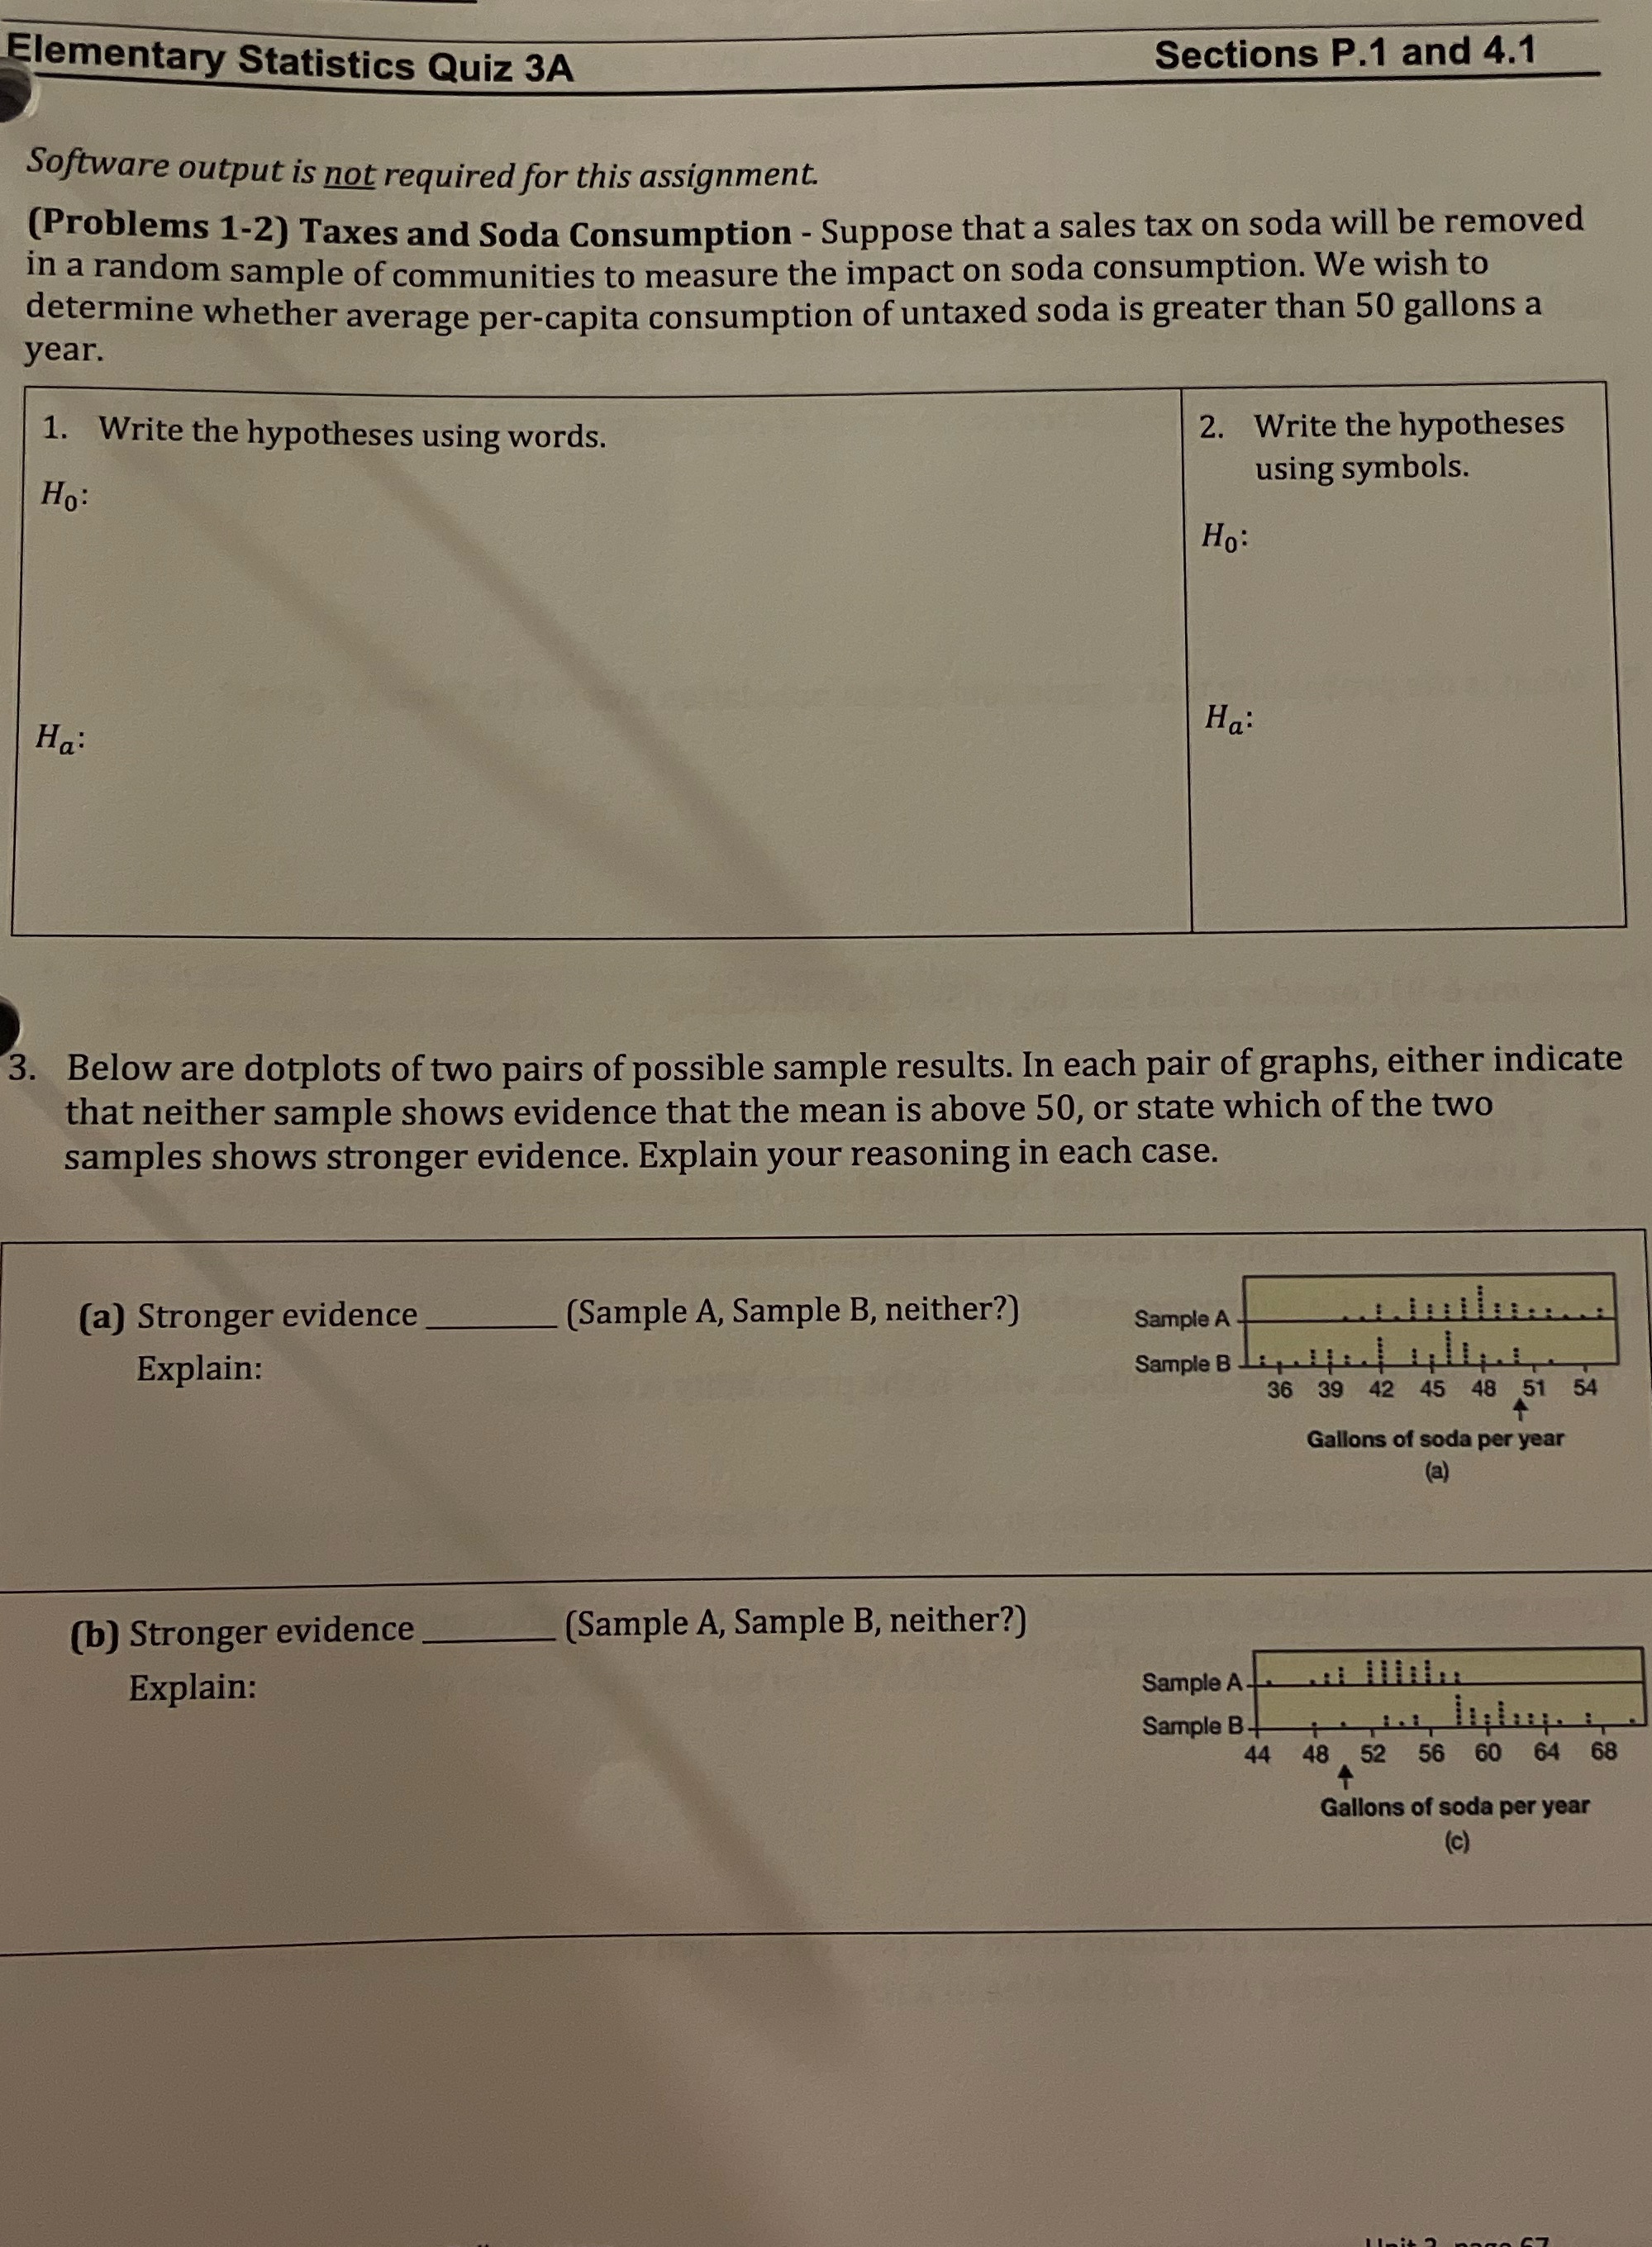
Elementary Statistics Quiz 3A Sections P.1 and 4.1 Software output is not required for this assignment. (Problems 1-2) Taxes and Soda Consumption - Suppose that a sales tax on soda will be removed in a random sample of communities to measure the impact on soda consumption. We wish to determine whether average per-capita consumption of untaxed soda is greater than 50 gallons a year. 1. Write the hypotheses using words. 2. Write the hypotheses Ho: using symbols. Ho: Ha: Ha: 3. Below are dotplots of two pairs of possible sample results. In each pair of graphs, either indicate that neither sample shows evidence that the mean is above 50, or state which of the two samples shows stronger evidence. Explain your reasoning in each case. (a) Stronger evidence (Sample A, Sample B, neither?) Sample A Explain: Sample Be 36 39 42 45 48 51 54 Gallons of soda per year (a) (b) Stronger evidence (Sample A, Sample B, neither?) Explain: Sample Ait iLiLi Sample B- 44 48 52 56 60 64 68 Gallons of soda per year (c)
Step by Step Solution
There are 3 Steps involved in it

Get step-by-step solutions from verified subject matter experts