

Question: Elementary Statistics Section P60 Spring 2022 CO Chrissy Brown 03/2 =Quiz: Quiz 2 Question 9 of 15 This quiz: 15 point(s) possible This question: 1
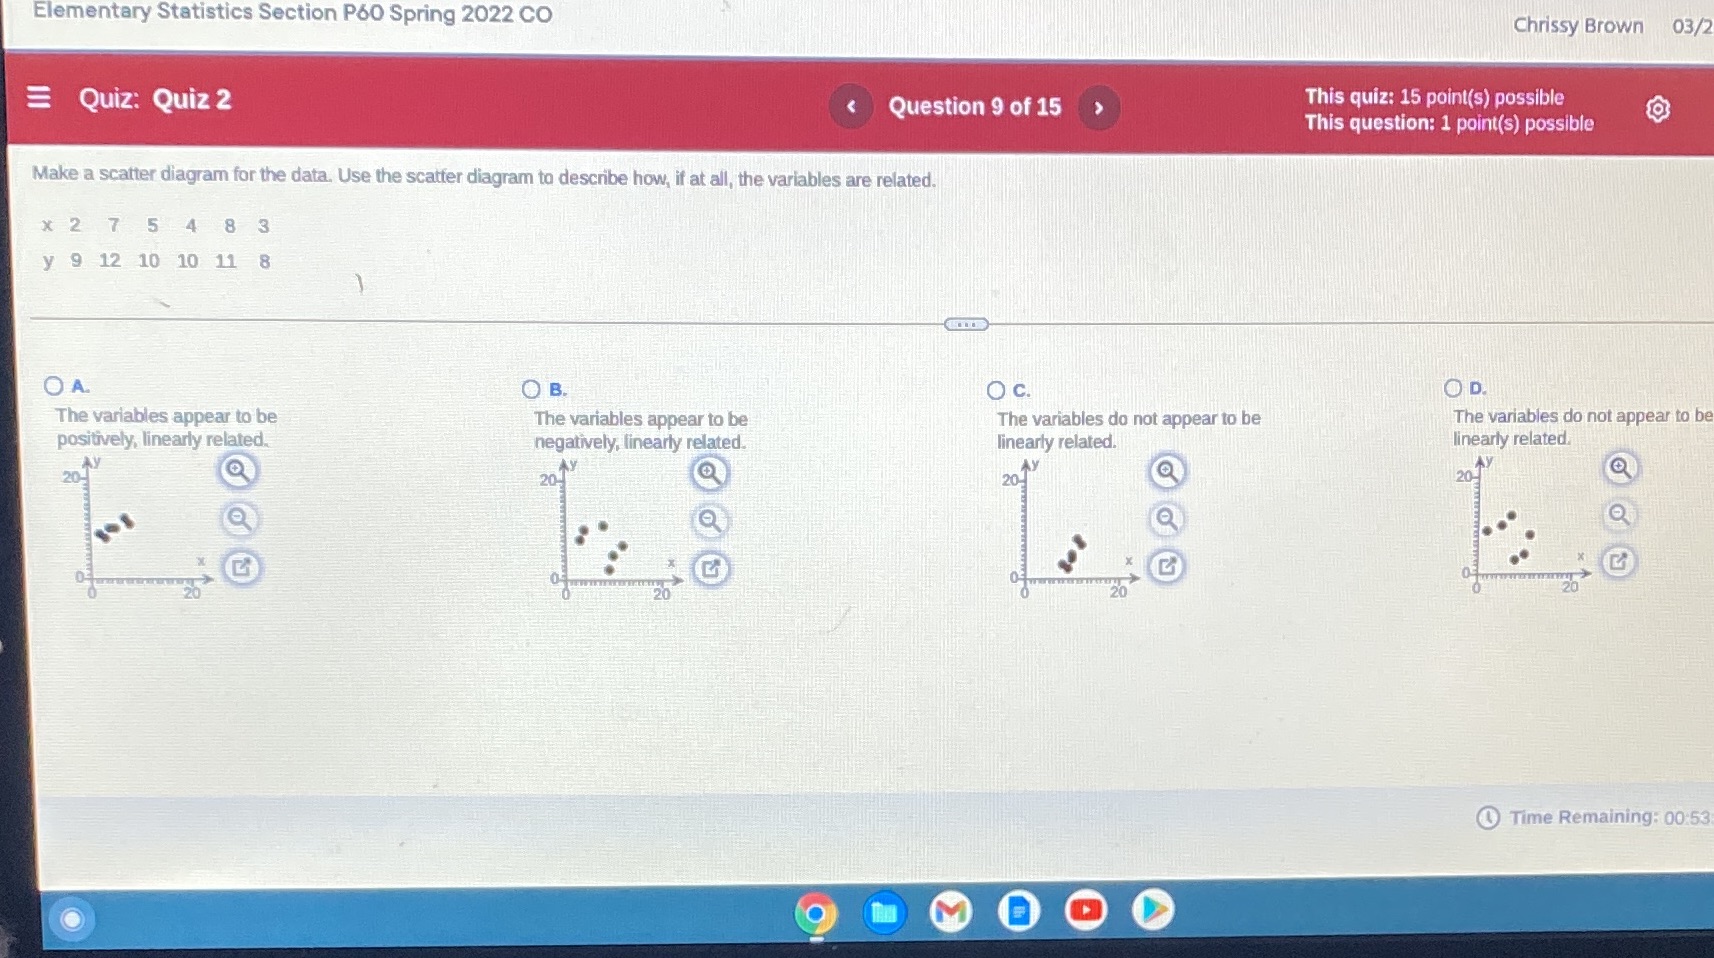
Elementary Statistics Section P60 Spring 2022 CO Chrissy Brown 03/2 =Quiz: Quiz 2 Question 9 of 15 This quiz: 15 point(s) possible This question: 1 point(s) possible Make a scatter diagram for the data. Use the scatter diagram to describe how, if at all, the variables are related. x 2 7 5 4 8 3 y 9 12 10 10 11 8 OA. O B. O c. OD The variables appear to be The variables appear to be The variables do not appear to be The variables do not appear to be positively, linearly related. negatively, linearly related. linearly related. linearly related. 20 AY LAY 20 20 20 Q 20 Time Remaining: 00:53
Step by Step Solution
There are 3 Steps involved in it
1 Expert Approved Answer
Step: 1 Unlock

Question Has Been Solved by an Expert!
Get step-by-step solutions from verified subject matter experts
Step: 2 Unlock
Step: 3 Unlock