

Question: ellness Central The graph illustrates a normal distribution for the prices paid for a particular model of HD television. The tTutor mean price paid is
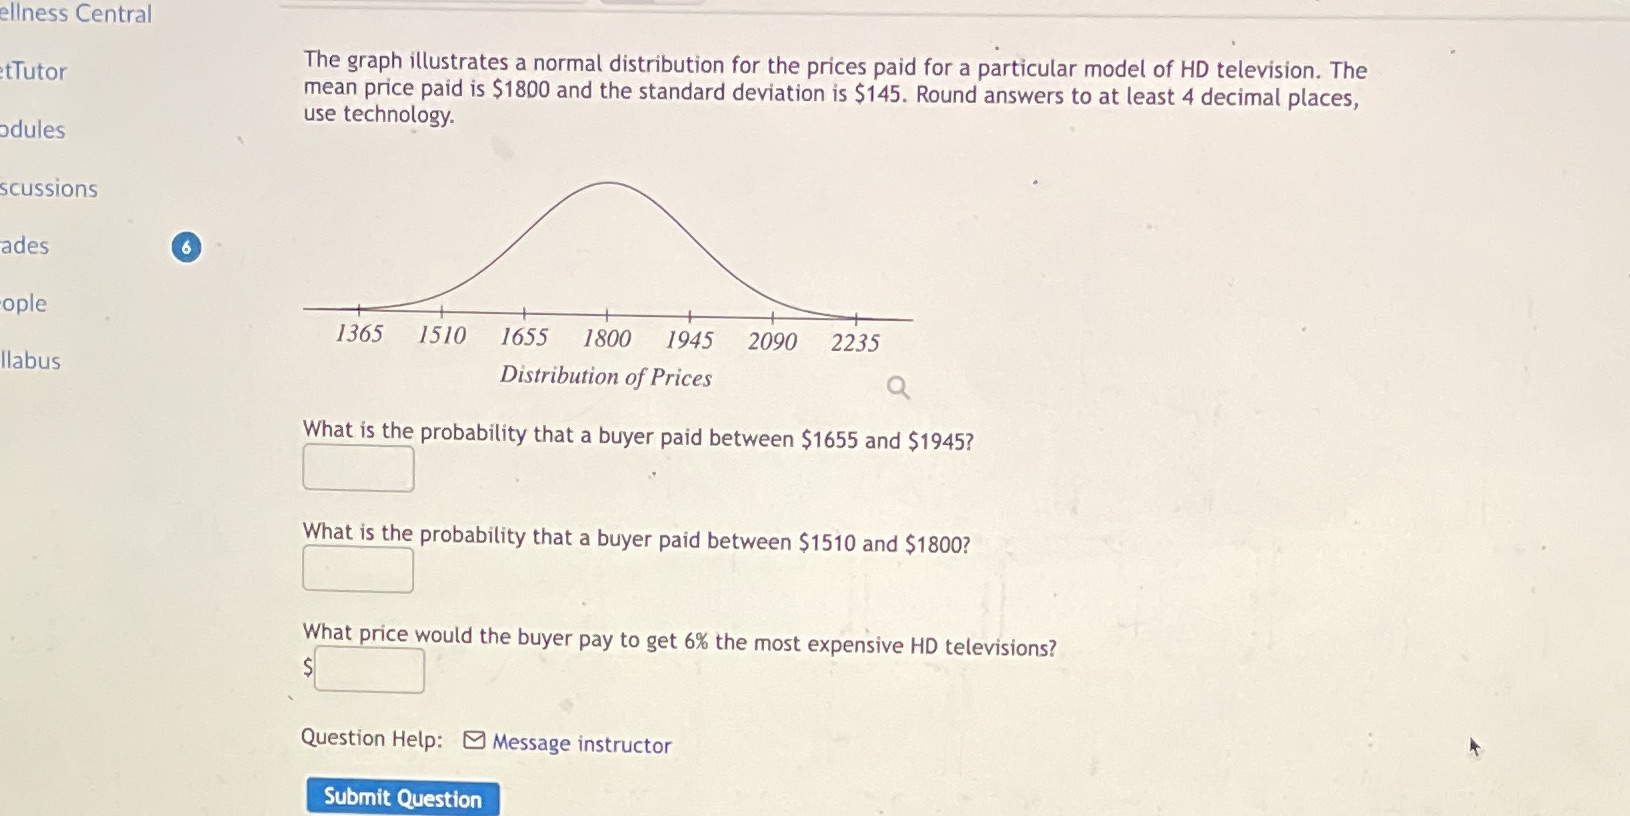
ellness Central The graph illustrates a normal distribution for the prices paid for a particular model of HD television. The tTutor mean price paid is $1800 and the standard deviation is $145. Round answers to at least 4 decimal places, use technology. odules scussions ades 6 ople 1365 1510 1655 1800 1945 2090 2235 llabus Distribution of Prices Q What is the probability that a buyer paid between $1655 and $1945? What is the probability that a buyer paid between $1510 and $1800? What price would the buyer pay to get 6% the most expensive HD televisions? Question Help: Message instructor Submit
Step by Step Solution
There are 3 Steps involved in it
1 Expert Approved Answer
Step: 1 Unlock

Question Has Been Solved by an Expert!
Get step-by-step solutions from verified subject matter experts
Step: 2 Unlock
Step: 3 Unlock