

Question: emergency pleasee !! am sorry about this problem. if these pictures are not readable, can you send your e mail adress. can share excel fiel.
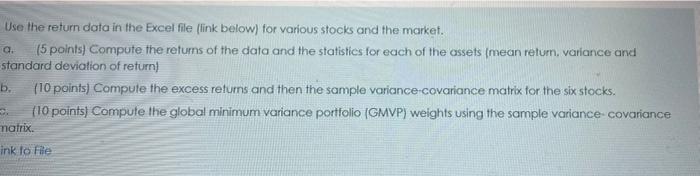
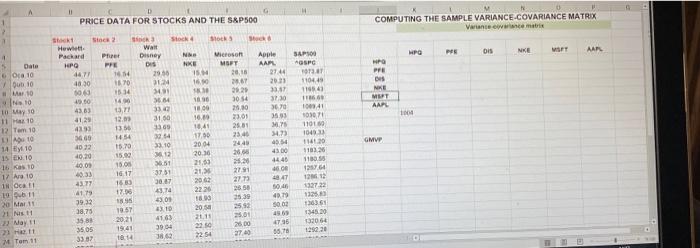
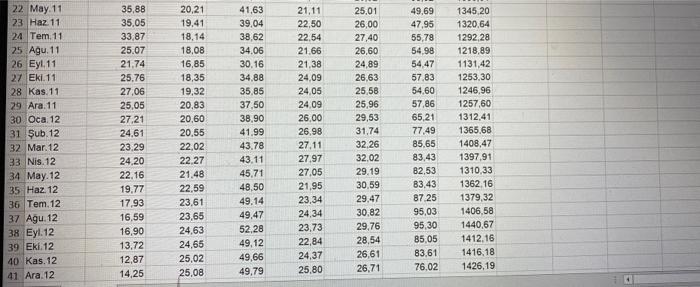
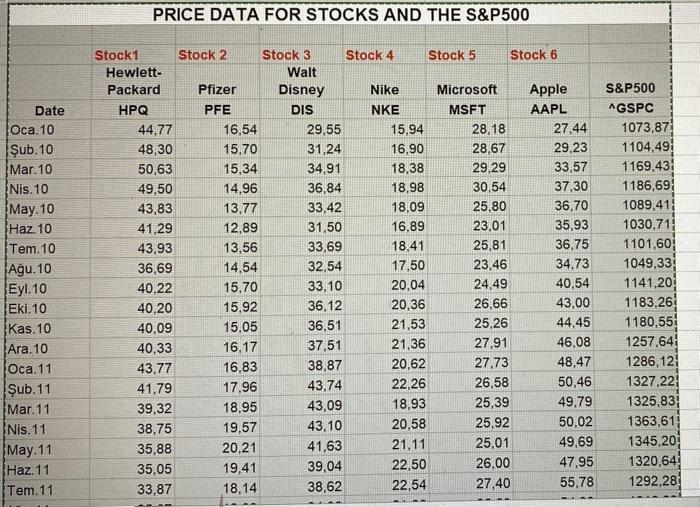
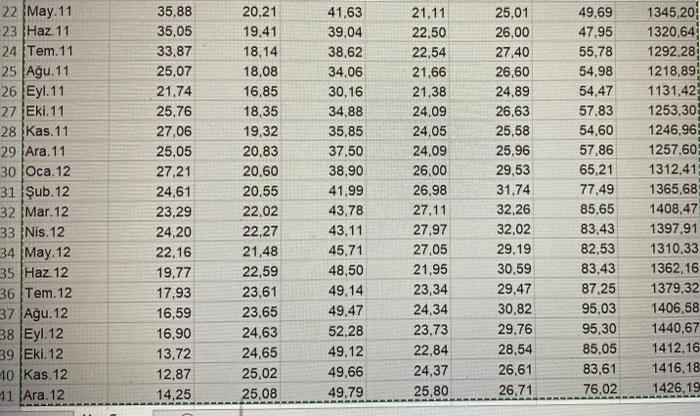
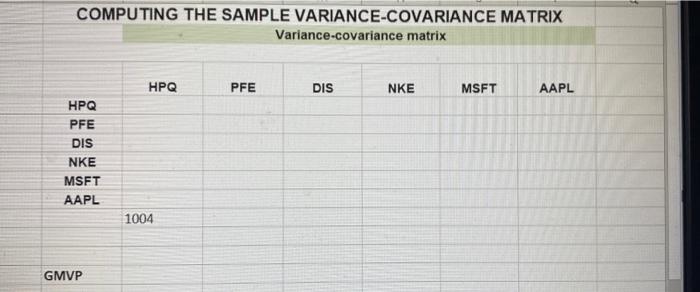
Use the return data in the Excel file (link below) for various stocks and the market. a. (5 points) Compute the returns of the data and the statistics for each of the assets (mean retum, variance and standard deviation of return) b. (10 points) Compute the excess returns and then the sample variance covariance matrix for the six stocks. (10 points) Compute the global minimum variance portfolio (GMVP) weights using the sample variance covariance matrix. ink to File PRICE DATA FOR STOCKS AND THE S&P500 COMPUTING THE SAMPLE VARIANCE.COVARIANCE MATRIX Variante www matris Stock SIS SR PE is NE WIFT AAR WN WA Disney DIS 20:56 31 Apple AAR 2744 HPG PFE 15 1650 SAP SPC 03.07 110449 11943 Dale O 10 Dub 10 10 10 10 May 30 2013 ER 364 06 331 3730 360 NE MURT AAR 1000 Sot Sto Hewitt Packard Prue HPG PRE 467/ 1654 4850 10 5063 1534 49.50 140 4303 13,1 1129 12. 4293 1356 360 1454 1032 15.70 40,20 15.00 40.00 18.00 40:33 10.17 16.30 41.79 17.00 39.32 16 38,75 35.00 20 21 350 19:41 3387 14 Microsoft MSPT 2018 267 20.20 3054 20.30 23.01 25.00 2340 244 2003 22 271 273 3342 31.50 3569 32.54 3310 12 851 3751 30 43 GMVP 1800 10.10 18.45 17.00 2004 20.30 21.00 21.30 2062 2220 10041 0907 11010 104333 11620 110326 1130 12 Tom 10 110 14.10 15 EN.10 16 10 17 Ara 10 18 Oct 19 Dub 20 Mar 11 1 N 1 3 May 11 21 11 M Tom 1 MS 14) 49.14 4300 4440 40.00 4841 SO 40.70 50.02 2 0 205 2011 30 41 63 30.04 3862 132722 13 136361 1345.20 13306 129220 3539 25.3 25.01 25.00 2740 4796 56.78 22 May 11 23 Haz 11 24 Tem. 11 25 Agu. 11 26 Eyl.11 27 Eki 11 28 Kas 11 29 Ara, 11 30 Oca 12 31 ub 12 32 Mar. 12 33 Nis. 12 34 May. 12 35 Haz 12 36 Tem. 12 37 Agu 12 38 Eyl.12 39 Eki 12 40 Kas. 12 41 Ara, 12 35,88 35.05 33.87 25.07 21.74 25.76 27,06 25,05 27.21 24,61 23.29 24,20 22.16 19,77 17.93 16,59 16,90 13,72 12,87 14,25 20,21 19,41 18,14 18,08 16,85 18,35 19,32 20.83 20,60 20.55 22,02 22.27 21,48 22.59 23.61 23,65 24.63 24,65 25.02 25.08 41,63 39,04 38,62 34.06 30.16 34.88 35,85 37,50 38,90 41.99 43.78 43.11 4571 48,50 49.14 49.47 52.28 49,12 49,66 49,79 21.11 22,50 22,54 21.66 21,38 24,09 24.05 24.09 26,00 26,98 27.11 27,97 27.05 21,95 23,34 24,34 23,73 22,84 24,37 25,80 25.01 26,00 27,40 26,60 24,89 26,63 25,58 25,96 29,53 31,74 32.26 32.02 29.19 30.59 29.47 30.82 29,76 28,54 26,61 26,71 49,69 47,95 55,78 54.98 54,47 57.83 54,60 57.86 65.21 77.49 85,65 83.43 82,53 83.43 87.25 95,03 95,30 85,05 83,61 76.02 1345,20 1320,64 1292 28 1218.89 1131,42 1253,30 1246,96 1257,60 1312.41 1365.68 1408,47 1397,91 1310,33 1362 16 1379,32 1406,58 1440,67 1412.16 1416,18 1426,19 PRICE DATA FOR STOCKS AND THE S&P500 Date Oca. 10 ub. 10 Mar. 10 Nis. 10 May. 10 Haz. 10 Tem. 10 Au. 10 Eyl. 10 Eki.10 Kas. 10 Ara. 10 Oca. 11 ub. 11 Mar. 11 Nis. 11 May.11 Haz. 11 Tem. 11 Stock1 Stock 2 Stock 3 Stock 4 Stock 5 Stock 6 Hewlett- Walt Packard Pfizer Disney Nike Microsoft Apple HPQ PFE DIS NKE MSFT AAPL 44.77 16,54 29,55 15,94 28,18 27,44 48,30 15.70 31,24 16,90 28,67 29,23 50,63 15.34 34,91 18,38 29,29 33,57 49,50 14,96 36,84 18,98 30,54 37,30 43,83 13.77 33,42 18.09 25,80 36,70 41,29 12,89 31,50 16,89 23.01 35,93 43,93 13,56 33,69 18.41 25,81 36,75 36,69 14,54 32,54 17,50 23,46 34,73 40,22 15,70 33,10 20,04 24.49 40,54 40,20 15,92 36.12 20,36 26,66 43,00 40,09 15.05 36,51 21,53 25,26 44,45 40,33 16,17 37,51 21,36 27,91 46.08 43,77 16,83 38,87 20,62 27.73 48,47 41,79 17,96 43,74 22.26 26,58 50,46 39,32 18,95 43,09 18,93 25,39 49.79 38,75 19,57 43,10 20,58 25.92 50,02 35,88 20,21 41,63 21.11 25,01 49,69 35,05 19,41 39,04 22,50 26,00 47.95 33,87 18,14 38,62 22,54 55,78 27,40 S&P500 AGSPC 1073.87 1104,49 1169,43 1186,69: 1089,411 1030.71 1101,60 1049,33 1141,20 1183,26 1180,55 1257.64 1286,12 1327.22 1325,83 1363,611 1345,20 1320,64 1292.28 22 May. 11 23 Haz. 11 24 Tem. 11 25 Au.11 26 Eyl. 11 27 Eki. 11 28 Kas. 11 29 Ara, 11 30 Oca. 12 31 ub 12 32 Mar.12 33 Nis. 12 34 May. 12 35 Haz. 12 36 Tem.12 37 Au. 12 38 Eyl.12 39 Eki. 12 10 Kas. 12 11 Ara, 12 35,88 35,05 33,87 25.07 21,74 25,76 27,06 25.05 27,21 24,61 23,29 24,20 22.16 19,77 17,93 16,59 16,90 13.72 12,87 14,25 20,21 19,41 18,14 18,08 16,85 18,35 19,32 20.83 20,60 20,55 22.02 22.27 21,48 22,59 23,61 23,65 24,63 24,65 25,02 25.08 41,63 39,04 38,62 34,06 30,16 34.88 35,85 37,50 38,90 41.99 43,78 43.11 45.71 48.50 49.14 49.47 52,28 49.12 49.66 49.79 21.11 22,50 22,54 21,66 21,38 24,09 24,05 24,09 26,00 26.98 27.11 27.97 27.05 21,95 23,34 24,34 23.73 22,84 24,37 25,80 25.01 26.00 27,40 26,60 24,89 26,63 25,58 25.96 29,53 31,74 32.26 32,02 29.19 30,59 29,47 30,82 29.76 28,54 26,61 26,71 49,69 47,95 55,78 54,98 54,47 57.83 54,60 57,86 65,21 77,49 85,65 83,43 82,53 83.43 87.25 95,03 95,30 85,05 83,61 76,02 1345,20 1320,64 1292,28 1218,89! 1131,42 1253,30 1246.96 1257.60 1312.41 1365,68 1408,47 1397.91 1310.33 1362,16 1379.32 1406,58 1440,67 1412.16 1416.18 1426,19 COMPUTING THE SAMPLE VARIANCE-COVARIANCE MATRIX Variance-covariance matrix HPQ PFE DIS NKE MSFT AAPL HPQ PFE DIS NKE MSET AAPL 1004 GMVP Your question is too long, Please make sure you're just asking one question and only include the necessary information for the question to be answered. OK Use the return data in the Excel file (link below) for various stocks and the market. a. (5 points) Compute the returns of the data and the statistics for each of the assets (mean retum, variance and standard deviation of return) b. (10 points) Compute the excess returns and then the sample variance covariance matrix for the six stocks. (10 points) Compute the global minimum variance portfolio (GMVP) weights using the sample variance covariance matrix. ink to File PRICE DATA FOR STOCKS AND THE S&P500 COMPUTING THE SAMPLE VARIANCE.COVARIANCE MATRIX Variante www matris Stock SIS SR PE is NE WIFT AAR WN WA Disney DIS 20:56 31 Apple AAR 2744 HPG PFE 15 1650 SAP SPC 03.07 110449 11943 Dale O 10 Dub 10 10 10 10 May 30 2013 ER 364 06 331 3730 360 NE MURT AAR 1000 Sot Sto Hewitt Packard Prue HPG PRE 467/ 1654 4850 10 5063 1534 49.50 140 4303 13,1 1129 12. 4293 1356 360 1454 1032 15.70 40,20 15.00 40.00 18.00 40:33 10.17 16.30 41.79 17.00 39.32 16 38,75 35.00 20 21 350 19:41 3387 14 Microsoft MSPT 2018 267 20.20 3054 20.30 23.01 25.00 2340 244 2003 22 271 273 3342 31.50 3569 32.54 3310 12 851 3751 30 43 GMVP 1800 10.10 18.45 17.00 2004 20.30 21.00 21.30 2062 2220 10041 0907 11010 104333 11620 110326 1130 12 Tom 10 110 14.10 15 EN.10 16 10 17 Ara 10 18 Oct 19 Dub 20 Mar 11 1 N 1 3 May 11 21 11 M Tom 1 MS 14) 49.14 4300 4440 40.00 4841 SO 40.70 50.02 2 0 205 2011 30 41 63 30.04 3862 132722 13 136361 1345.20 13306 129220 3539 25.3 25.01 25.00 2740 4796 56.78 22 May 11 23 Haz 11 24 Tem. 11 25 Agu. 11 26 Eyl.11 27 Eki 11 28 Kas 11 29 Ara, 11 30 Oca 12 31 ub 12 32 Mar. 12 33 Nis. 12 34 May. 12 35 Haz 12 36 Tem. 12 37 Agu 12 38 Eyl.12 39 Eki 12 40 Kas. 12 41 Ara, 12 35,88 35.05 33.87 25.07 21.74 25.76 27,06 25,05 27.21 24,61 23.29 24,20 22.16 19,77 17.93 16,59 16,90 13,72 12,87 14,25 20,21 19,41 18,14 18,08 16,85 18,35 19,32 20.83 20,60 20.55 22,02 22.27 21,48 22.59 23.61 23,65 24.63 24,65 25.02 25.08 41,63 39,04 38,62 34.06 30.16 34.88 35,85 37,50 38,90 41.99 43.78 43.11 4571 48,50 49.14 49.47 52.28 49,12 49,66 49,79 21.11 22,50 22,54 21.66 21,38 24,09 24.05 24.09 26,00 26,98 27.11 27,97 27.05 21,95 23,34 24,34 23,73 22,84 24,37 25,80 25.01 26,00 27,40 26,60 24,89 26,63 25,58 25,96 29,53 31,74 32.26 32.02 29.19 30.59 29.47 30.82 29,76 28,54 26,61 26,71 49,69 47,95 55,78 54.98 54,47 57.83 54,60 57.86 65.21 77.49 85,65 83.43 82,53 83.43 87.25 95,03 95,30 85,05 83,61 76.02 1345,20 1320,64 1292 28 1218.89 1131,42 1253,30 1246,96 1257,60 1312.41 1365.68 1408,47 1397,91 1310,33 1362 16 1379,32 1406,58 1440,67 1412.16 1416,18 1426,19 PRICE DATA FOR STOCKS AND THE S&P500 Date Oca. 10 ub. 10 Mar. 10 Nis. 10 May. 10 Haz. 10 Tem. 10 Au. 10 Eyl. 10 Eki.10 Kas. 10 Ara. 10 Oca. 11 ub. 11 Mar. 11 Nis. 11 May.11 Haz. 11 Tem. 11 Stock1 Stock 2 Stock 3 Stock 4 Stock 5 Stock 6 Hewlett- Walt Packard Pfizer Disney Nike Microsoft Apple HPQ PFE DIS NKE MSFT AAPL 44.77 16,54 29,55 15,94 28,18 27,44 48,30 15.70 31,24 16,90 28,67 29,23 50,63 15.34 34,91 18,38 29,29 33,57 49,50 14,96 36,84 18,98 30,54 37,30 43,83 13.77 33,42 18.09 25,80 36,70 41,29 12,89 31,50 16,89 23.01 35,93 43,93 13,56 33,69 18.41 25,81 36,75 36,69 14,54 32,54 17,50 23,46 34,73 40,22 15,70 33,10 20,04 24.49 40,54 40,20 15,92 36.12 20,36 26,66 43,00 40,09 15.05 36,51 21,53 25,26 44,45 40,33 16,17 37,51 21,36 27,91 46.08 43,77 16,83 38,87 20,62 27.73 48,47 41,79 17,96 43,74 22.26 26,58 50,46 39,32 18,95 43,09 18,93 25,39 49.79 38,75 19,57 43,10 20,58 25.92 50,02 35,88 20,21 41,63 21.11 25,01 49,69 35,05 19,41 39,04 22,50 26,00 47.95 33,87 18,14 38,62 22,54 55,78 27,40 S&P500 AGSPC 1073.87 1104,49 1169,43 1186,69: 1089,411 1030.71 1101,60 1049,33 1141,20 1183,26 1180,55 1257.64 1286,12 1327.22 1325,83 1363,611 1345,20 1320,64 1292.28 22 May. 11 23 Haz. 11 24 Tem. 11 25 Au.11 26 Eyl. 11 27 Eki. 11 28 Kas. 11 29 Ara, 11 30 Oca. 12 31 ub 12 32 Mar.12 33 Nis. 12 34 May. 12 35 Haz. 12 36 Tem.12 37 Au. 12 38 Eyl.12 39 Eki. 12 10 Kas. 12 11 Ara, 12 35,88 35,05 33,87 25.07 21,74 25,76 27,06 25.05 27,21 24,61 23,29 24,20 22.16 19,77 17,93 16,59 16,90 13.72 12,87 14,25 20,21 19,41 18,14 18,08 16,85 18,35 19,32 20.83 20,60 20,55 22.02 22.27 21,48 22,59 23,61 23,65 24,63 24,65 25,02 25.08 41,63 39,04 38,62 34,06 30,16 34.88 35,85 37,50 38,90 41.99 43,78 43.11 45.71 48.50 49.14 49.47 52,28 49.12 49.66 49.79 21.11 22,50 22,54 21,66 21,38 24,09 24,05 24,09 26,00 26.98 27.11 27.97 27.05 21,95 23,34 24,34 23.73 22,84 24,37 25,80 25.01 26.00 27,40 26,60 24,89 26,63 25,58 25.96 29,53 31,74 32.26 32,02 29.19 30,59 29,47 30,82 29.76 28,54 26,61 26,71 49,69 47,95 55,78 54,98 54,47 57.83 54,60 57,86 65,21 77,49 85,65 83,43 82,53 83.43 87.25 95,03 95,30 85,05 83,61 76,02 1345,20 1320,64 1292,28 1218,89! 1131,42 1253,30 1246.96 1257.60 1312.41 1365,68 1408,47 1397.91 1310.33 1362,16 1379.32 1406,58 1440,67 1412.16 1416.18 1426,19 COMPUTING THE SAMPLE VARIANCE-COVARIANCE MATRIX Variance-covariance matrix HPQ PFE DIS NKE MSFT AAPL HPQ PFE DIS NKE MSET AAPL 1004 GMVP Your question is too long, Please make sure you're just asking one question and only include the necessary information for the question to be answered. OK
Step by Step Solution
There are 3 Steps involved in it

Get step-by-step solutions from verified subject matter experts