

Question: en 2 A CVP graph appears below for Watson Inc. ed out of on 12000 10000 8000 6000 4000 2000 0 0 100 200 Cine
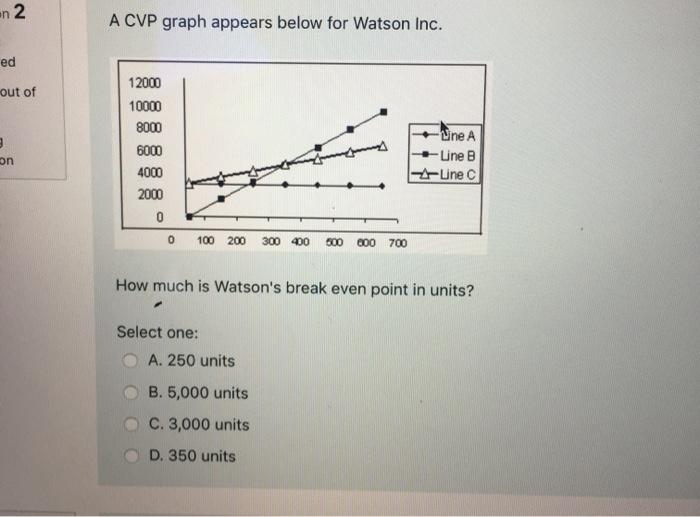
en 2 A CVP graph appears below for Watson Inc. ed out of on 12000 10000 8000 6000 4000 2000 0 0 100 200 Cine A Line B -Linec 300 400 500 600 700 How much is Watson's break even point in units? Select one: A. 250 units B. 5,000 units C. 3,000 units D. 350 units
Step by Step Solution
There are 3 Steps involved in it
1 Expert Approved Answer
Step: 1 Unlock

Question Has Been Solved by an Expert!
Get step-by-step solutions from verified subject matter experts
Step: 2 Unlock
Step: 3 Unlock