

Question: End construction delays with Spectra Our drone data solutions for roads & railways help project management consultants, infrastructure developers, and surveyors cut down time and
End construction delays with Spectra
Our drone data solutions for roads & railways help project management consultants, infrastructure developers, and surveyors cut down time and cost overruns - all on the cloud.
Welcome to the infrastructure network of the future.
Contact Sales
Conduct faster surveys. Bid for more projects. Take control of construction deadlines. End subcontractor misreporting. Improve operational efficiency. Maximize profitability.
PLANNING
Bid smarter and acquire land faster
Spectra helps infrastructure developers use aerial maps and 3-D models to classify land use for time sensitive land acquisition and estimate costs/timelines of construction with greater accuracy.
OVERVIEW
Total length 260 km.
Corridor width 50 m
LAND ACQUISITION
Built-up Area 5%
No. of trees 3408
CONSTRUCTION
Monitor & manage construction remotely
EPCs can now monitor construction performance with high resolution aerial videos that identify deviations from the plan and ensure compliance
Build Faster
CONSTRUCTION PROGRESS
Rate of construction 5 km/day
No. of contractors 4
OVERVIEW
Total length 260km
Completed 109km
MONITORING
Sustain infrastructure for longer
Drone data enabled solutions from Spectra ensure that roads and railways last longer through visual and thermal based inspection analytics that detect vegetative encroachments and deterioration
Sustain Longer
OVERVIEW
Total length 260 km
Corridor width 50 m
MAINTENANCE
Encroachments 260km
Cracks 45
HOW IT WORKS
Why infrastructure teams love Spectra
Visualize portfolio
Manage your geographically distributed asset base from one absolute source of truth
Monitor anywhere
Inspect everything
Go through this above article of Transport Industry of Skylark Drones Company and determine the market size/share in the specific sector in the below mentioned image format.
Please try to calculate TMP, TAM, SAM & ESAM with proper assumption, in the below image format & post it.
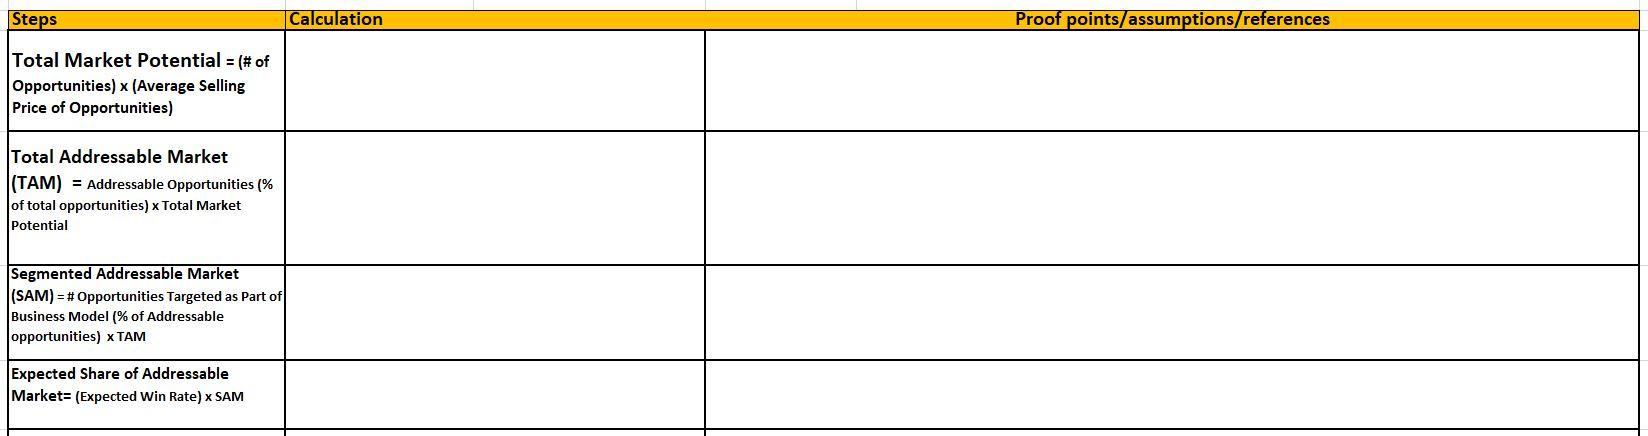
Steps Calculation Proof points/assumptions/references Total Market Potential = (# of Opportunities) x (Average Selling Price of Opportunities) Total Addressable Market (TAM) = Addressable Opportunities (% of total opportunities) x Total Market Potential Segmented Addressable Market (SAM) = # Opportunities Targeted as part of Business Model (% of Addressable opportunities) TAM Expected Share of Addressable Market (Expected Win Rate) X SAM Steps Calculation Proof points/assumptions/references Total Market Potential = (# of Opportunities) x (Average Selling Price of Opportunities) Total Addressable Market (TAM) = Addressable Opportunities (% of total opportunities) x Total Market Potential Segmented Addressable Market (SAM) = # Opportunities Targeted as part of Business Model (% of Addressable opportunities) TAM Expected Share of Addressable Market (Expected Win Rate) X SAM
Step by Step Solution
There are 3 Steps involved in it

Get step-by-step solutions from verified subject matter experts