

Question: Energy.xlsx is available ; the three sheets contain different data sets. The first sheet contains energy data pertaining to a constant a-axis while varying the
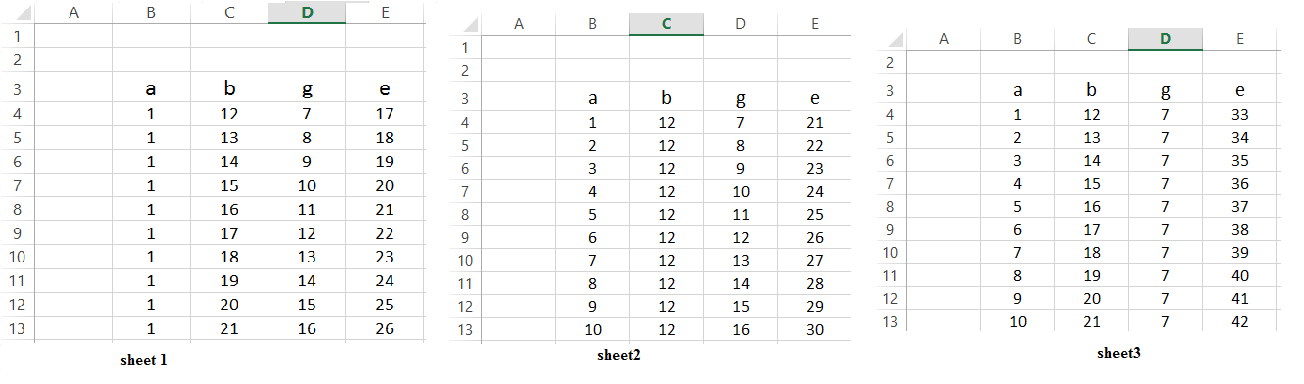
Energy.xlsx is available ; the three sheets contain different data sets. The first sheet contains energy data pertaining to a constant a-axis while varying the b-axis and gamma; the second sheet contains energy data pertaining to a constant b-axis while varying the a-axis and gamma; and the third sheet contains energy data pertaining to a constant gamma while varying the a- and b-axes. Create a script that imports the data from Excel into MATLAB. Plot three 3D graphs (one for the constant a-axis, one for the constant b-axis, and one for constant gamma). Also in the script, determine the minimum energy in each sheet and the parameters associated with it (a- and b-axes lengths and gamma); then determine the overall energy minimum for all of the data and the associated parameters. Your script should output 7 things: 3 graphs and 4 messages (one message for each of the required energy minima). Your graphs should be labeled and have color bars associated with them (include these in your homework).
12 13 17 18 19 20 21 12 12 12 12 12 12 12 12 12 12 12 13 14 15 16 17 18 19 20 21 21 34 35 36 37 38 39 40 15 16 17 23 24 25 26 27 28 29 30 10 10 12 1.3 14 15 16 10 6 12 13 14 15 16 6 2.3 24 25 26 10 10 12 13 19 20 21 12 13 13 10 10 sheet 1 sheet2 sheet3
Step by Step Solution
There are 3 Steps involved in it

Get step-by-step solutions from verified subject matter experts