

Question: Engagement grade = D Homework = 20% Quizzes = 20% Exams = 30% Projects = 20% (proposal = 5%, presentation = 5% and report =
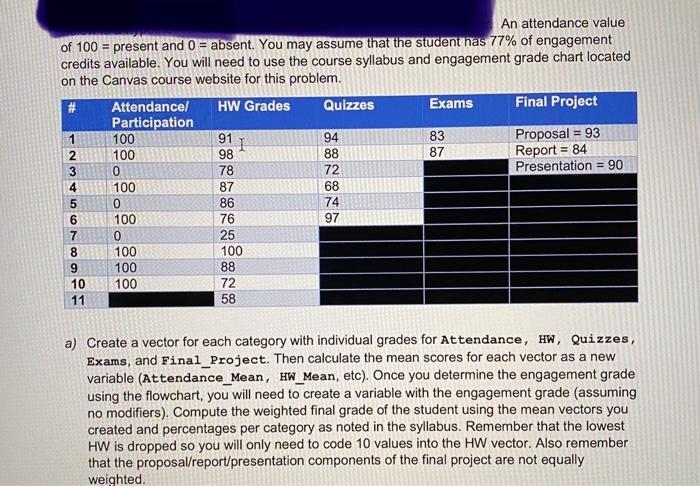
An attendance value of 100 = present and 0 = absent. You may assume that the student has 77% of engagement credits available. You will need to use the course syllabus and engagement grade chart located on the Canvas course website for this problem. # Attendance/ HW Grades Quizzes Exams Final Project Participation 1 100 91 94 83 1 Proposal = 93 2 100 98 88 87 Report = 84 3 0 78 72 Presentation = 90 4 100 87 68 5 0 86 74 6 100 76 97 7 0 25 8 100 100 9 100 88 10100 72 11 58 a) Create a vector for each category with individual grades for Attendance, HW, Quizzes, Exams, and Final_Project. Then calculate the mean scores for each vector as a new variable (Attendance_Mean, HW_Mean, etc). Once you determine the engagement grade using the flowchart, you will need to create a variable with the engagement grade (assuming no modifiers). Compute the weighted final grade of the student using the mean vectors you created and percentages per category as noted in the syllabus. Remember that the lowest HW is dropped so you will only need to code 10 values into the HW vector. Also remember that the proposal/report/presentation components of the final project are not equally weighted. An attendance value of 100 = present and 0 = absent. You may assume that the student has 77% of engagement credits available. You will need to use the course syllabus and engagement grade chart located on the Canvas course website for this problem. # Attendance/ HW Grades Quizzes Exams Final Project Participation 1 100 91 94 83 1 Proposal = 93 2 100 98 88 87 Report = 84 3 0 78 72 Presentation = 90 4 100 87 68 5 0 86 74 6 100 76 97 7 0 25 8 100 100 9 100 88 10100 72 11 58 a) Create a vector for each category with individual grades for Attendance, HW, Quizzes, Exams, and Final_Project. Then calculate the mean scores for each vector as a new variable (Attendance_Mean, HW_Mean, etc). Once you determine the engagement grade using the flowchart, you will need to create a variable with the engagement grade (assuming no modifiers). Compute the weighted final grade of the student using the mean vectors you created and percentages per category as noted in the syllabus. Remember that the lowest HW is dropped so you will only need to code 10 values into the HW vector. Also remember that the proposal/report/presentation components of the final project are not equally weighted
Step by Step Solution
There are 3 Steps involved in it

Get step-by-step solutions from verified subject matter experts