

Question: ENGINEERING PHYSICS PRACTICAL EXAMINATION 2020 Question 1 (5 marks) Analyze the data given below and draw a graph from the data to find the value

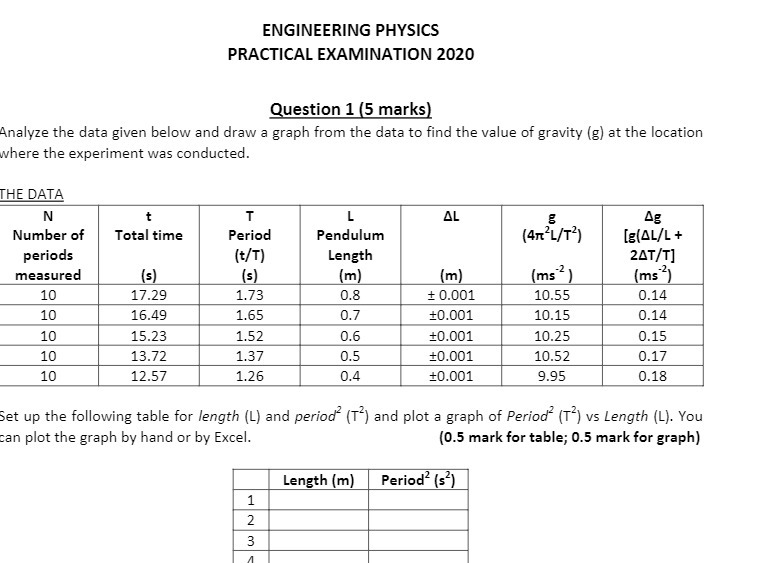
ENGINEERING PHYSICS PRACTICAL EXAMINATION 2020 Question 1 (5 marks) Analyze the data given below and draw a graph from the data to find the value of gravity (g) at the location where the experiment was conducted. THE DATA N t T L AL Ag Number of Total time Period Pendulum (4mc2L/T?) [E(AL/L + periods (t/T) Length 2AT/T] measured (s) (5) (m) (m) (ms (ms") 10 17.29 1.73 0.8 1 0.001 10.55 0.14 10 16.49 1.65 0.7 10.001 10.15 0.14 10 15.23 1.52 0.6 10.001 10.25 0.15 10 13.72 1.37 0.5 10.001 10.52 0.17 10 12.57 1.26 0.4 10.001 9.95 0.18 Set up the following table for length (L) and period (T') and plot a graph of Period (T') vs Length (L). You can plot the graph by hand or by Excel. (0.5 mark for table; 0.5 mark for graph) Length (m) Period (s?) 1 3
Step by Step Solution
There are 3 Steps involved in it

Get step-by-step solutions from verified subject matter experts