Question: ENGR 131 - Winter 2020-2021 - Programming Project 2 Clusterization of 2D Point Scatters Data collected by imaging is often processed to detect individual point-like

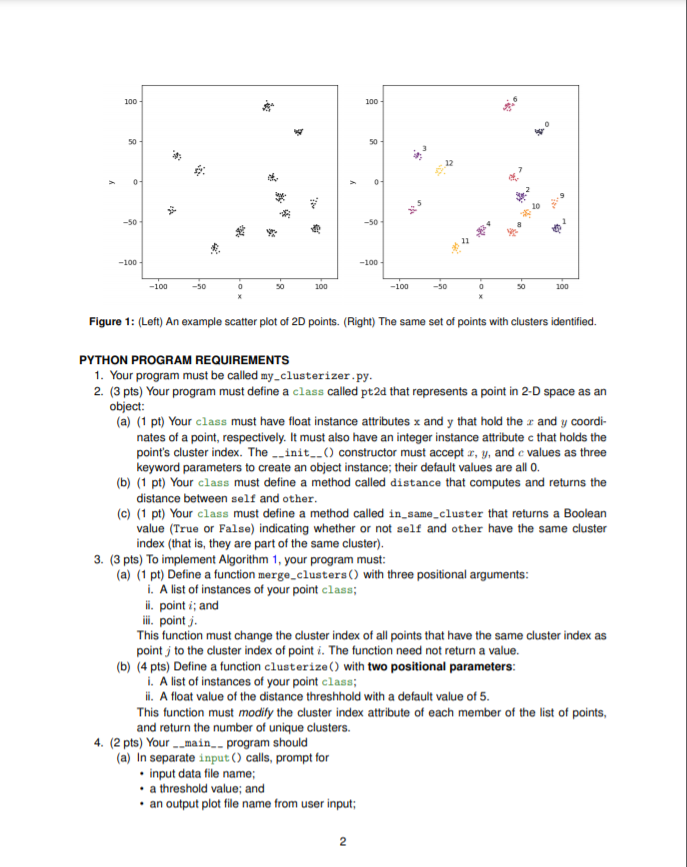
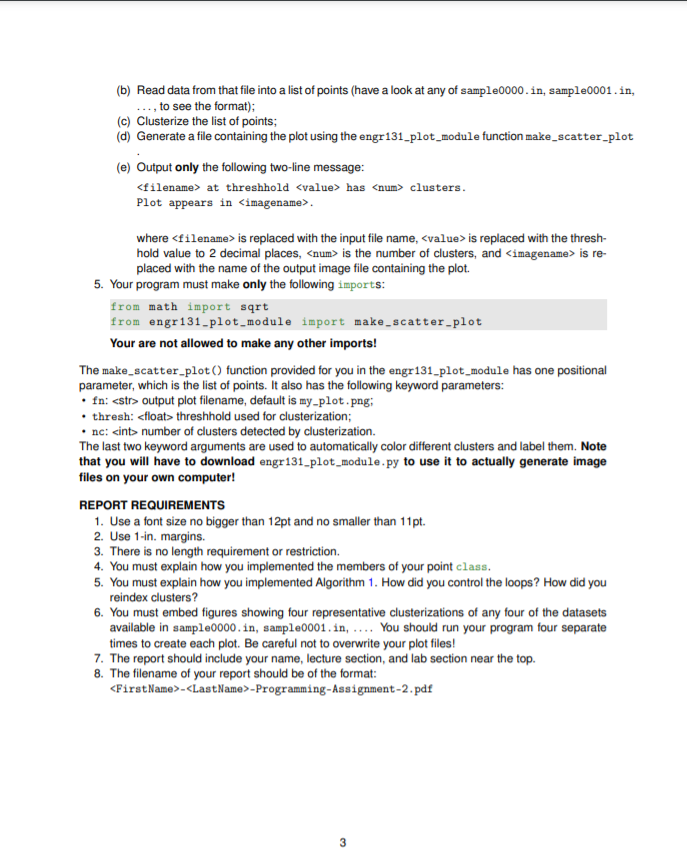
ENGR 131 - Winter 2020-2021 - Programming Project 2 Clusterization of 2D Point Scatters Data collected by imaging is often processed to detect individual point-like entities, like particles suspended in a fluid, or organisms in swarms, or stars in galaxies. A common processing method for point-like data is clustering, that is, automatic detection of distinct aggregations of points. In this assignment, you will write a Python program that will read in a set of 2D (2,y) points and, using a distance-based criterion, assign each point to a cluster. The criterion for deciding whether any two points belong to the same cluster is whether the distance between them is below some predefined threshhold value. An algorithm for identifying clusters in a for a set of points is below. Algorithm 1: Clusterization of 2D Point Scatters Input: A list of points; each point has an (x,y) position and a cluster index Result: Each point's cluster index indicating which cluster it belongs to for i i and j at threshold has clusters. Plot appears in where is replaced with the input file name, is replaced with the thresh- hold value to 2 decimal places, is the number of clusters, and is re- placed with the name of the output image file containing the plot. 5. Your program must make only the following imports: from math import sqrt from engr131-plot_module import make scatter-plot Your are not allowed to make any other imports! The make_scatter_plot() function provided for you in the engr131_plot_module has one positional parameter, which is the list of points. It also has the following keyword parameters: . fn: output plot filename, default is my-plot.png; thresh: number of clusters detected by clusterization. The last two keyword arguments are used to automatically color different clusters and label them. Note that you will have to download engr131_plot_module.py to use it to actually generate image files on your own computer! REPORT REQUIREMENTS 1. Use a font size no bigger than 12pt and no smaller than 11pt. 2. Use 1-in margins. 3. There is no length requirement or restriction. 4. You must explain how you implemented the members of your point class. 5. You must explain how you implemented Algorithm 1. How did you control the loops? How did you reindex clusters? 6. You must embed figures showing four representative clusterizations of any four of the datasets available in sample0000.in, sample0001.in, .... You should run your program four separate times to create each plot. Be careful not to overwrite your plot files! 7. The report should include your name, lecture section, and lab section near the top. 8. The filename of your report should be of the format: - -Programming-Assignment-2.pdf 3 ENGR 131 - Winter 2020-2021 - Programming Project 2 Clusterization of 2D Point Scatters Data collected by imaging is often processed to detect individual point-like entities, like particles suspended in a fluid, or organisms in swarms, or stars in galaxies. A common processing method for point-like data is clustering, that is, automatic detection of distinct aggregations of points. In this assignment, you will write a Python program that will read in a set of 2D (2,y) points and, using a distance-based criterion, assign each point to a cluster. The criterion for deciding whether any two points belong to the same cluster is whether the distance between them is below some predefined threshhold value. An algorithm for identifying clusters in a for a set of points is below. Algorithm 1: Clusterization of 2D Point Scatters Input: A list of points; each point has an (x,y) position and a cluster index Result: Each point's cluster index indicating which cluster it belongs to for i i and j at threshold has clusters. Plot appears in where is replaced with the input file name, is replaced with the thresh- hold value to 2 decimal places, is the number of clusters, and is re- placed with the name of the output image file containing the plot. 5. Your program must make only the following imports: from math import sqrt from engr131-plot_module import make scatter-plot Your are not allowed to make any other imports! The make_scatter_plot() function provided for you in the engr131_plot_module has one positional parameter, which is the list of points. It also has the following keyword parameters: . fn: output plot filename, default is my-plot.png; thresh: number of clusters detected by clusterization. The last two keyword arguments are used to automatically color different clusters and label them. Note that you will have to download engr131_plot_module.py to use it to actually generate image files on your own computer! REPORT REQUIREMENTS 1. Use a font size no bigger than 12pt and no smaller than 11pt. 2. Use 1-in margins. 3. There is no length requirement or restriction. 4. You must explain how you implemented the members of your point class. 5. You must explain how you implemented Algorithm 1. How did you control the loops? How did you reindex clusters? 6. You must embed figures showing four representative clusterizations of any four of the datasets available in sample0000.in, sample0001.in, .... You should run your program four separate times to create each plot. Be careful not to overwrite your plot files! 7. The report should include your name, lecture section, and lab section near the top. 8. The filename of your report should be of the format: - -Programming-Assignment-2.pdf 3


