

Question: ENGR 40 Moving Average Program When a plot is made from experimental data, sometimes the scatter of the data points is such that it is
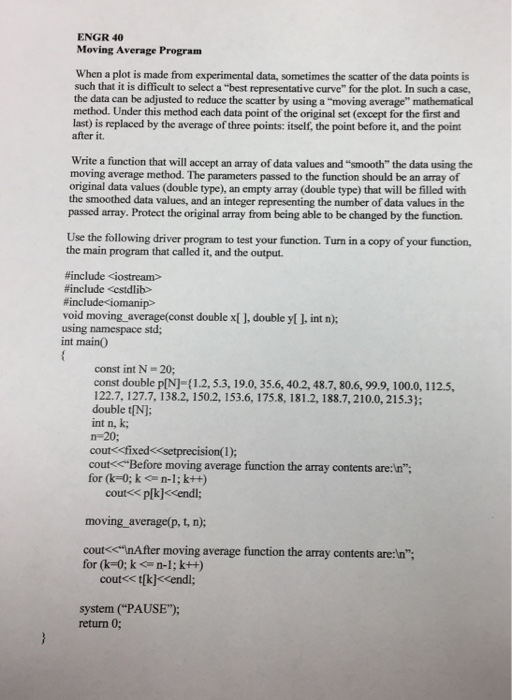
ENGR 40 Moving Average Program When a plot is made from experimental data, sometimes the scatter of the data points is such that it is difficult to select a "best representative curve" for the plot. In such a case, the data can be adjusted to reduce the scatter by using a "moving average" mathematical method. Under this method each data point of the original set (except for the first and last) is replaced by the average of three points: itself, the point before it, and the point after it. Write a function that will accept an array of data values and "smooth" the data using the moving average method. The parameters passed to the function should be an array of original data values (double type), an empty array (double type) that will be filled with the smoothed data values, and an integer representing the number of data values in the passed array. Protect the original array from being able to be changed by the function. Use the following driver program to test your function. Turn in a copy of your function, the main program that called it, and the output. #include
Step by Step Solution
There are 3 Steps involved in it

Get step-by-step solutions from verified subject matter experts