

Question: Enhance this Galton board simulation by printing a bar chart of the bottommost counters. Draw the bars vertically, below the last row of numbers. See
Enhance this Galton board simulation by printing a bar chart of the bottommost counters. Draw the bars vertically, below the last row of numbers. See the comments in the C++ source file for where to put your modified code.
// Enhanced version of galton.cpp with snazzy vertical bar graphs.
#include
#include
#include
#include
using namespace std;
int main()
{
srand(time(0));
int* counts[10];
// Allocate the rows
for (int i = 0; i
{
counts[i] = new int[i + 1];
for (int j = 0; j
{
counts[i][j] = 0;
}
}
const int RUNS = 1000;
// Simulate 1,000 balls
for (int run = 0; run
{
// Add a ball to the top
counts[0][0]++;
// Have the ball run to the bottom
int j = 0;
for (int i = 1; i
{
int r = rand() % 2;
// If r is even, move down, otherwise to the right
if (r == 1)
{
j++;
}
counts[i][j]++;
}
}
// Print all counts
for (int i = 0; i
{
for (int j = 0; j
{
cout
}
cout
}
// You will need to create the code here for the bar chart
// Step1: Compute the maximum count so that we can make
// the bar charts proportional to this number
// Step 2: Create an array of bar chart heights based on
// this computed max value
// Step 3: Print the bars across the bottom
// Deallocate the rows
for (int i = 0; i
{
delete[] counts[i];
}
return 0;
}
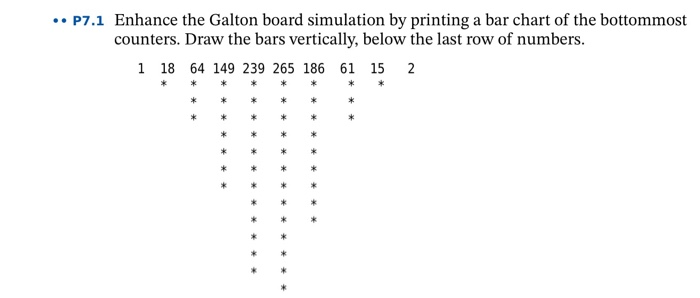
.. P7.1 Enhance the Galton board simulation by printing a bar chart of the bottommost counters. Draw the bars vertically, below the last row of numbers. 1 18 64 149 239 265 186 61 15 2 * * * * * * * * * * * * * * * * * *
Step by Step Solution
There are 3 Steps involved in it

Get step-by-step solutions from verified subject matter experts