

Question: Ensure the Customers worksheet is active then create a scatter plot chart that places the Years on the X axis and the Clients on the

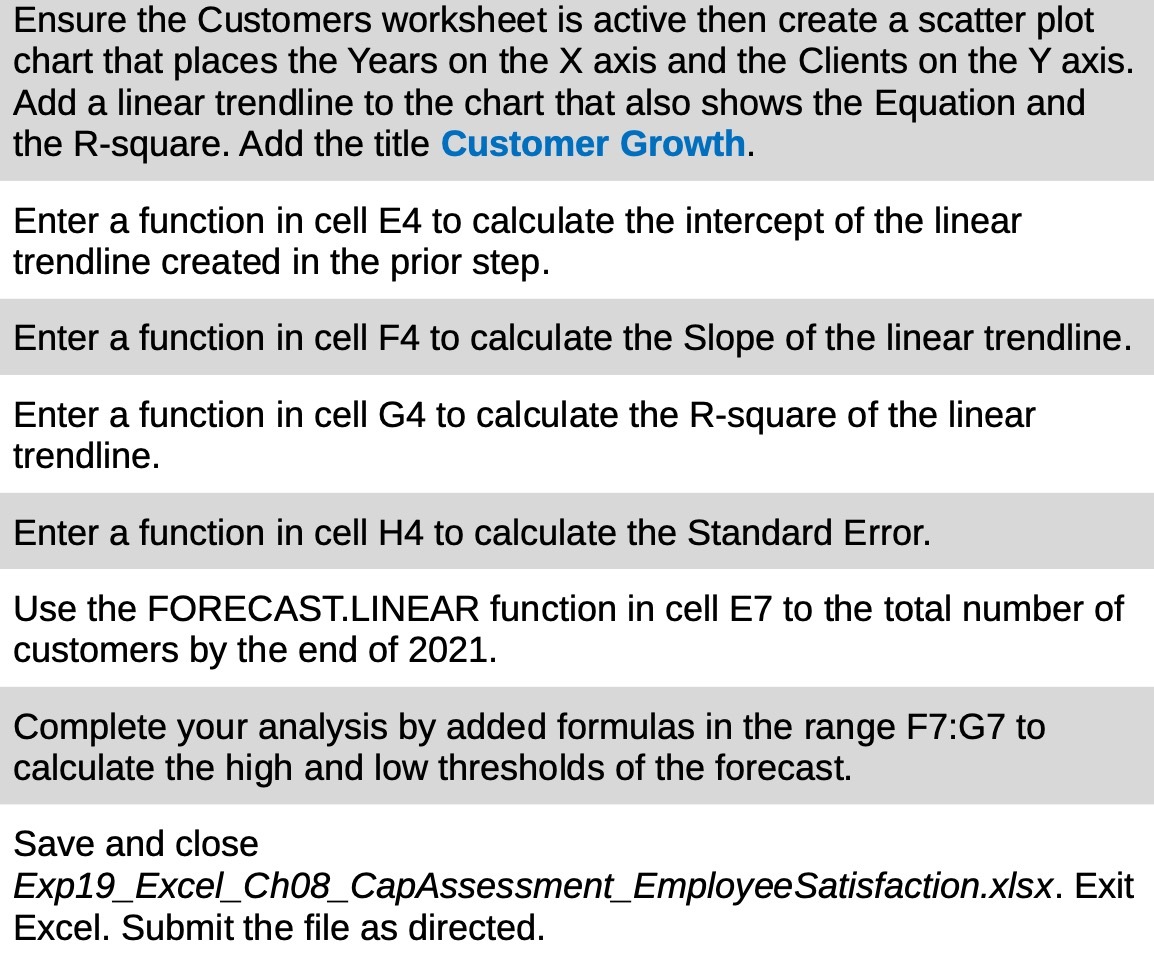
Ensure the Customers worksheet is active then create a scatter plot chart that places the Years on the X axis and the Clients on the Y axis. Add a linear trendline to the chart that also shows the Equation and the R-square. Add the title Customer Growth. Enter a function in cell E4 to calculate the intercept of the linear trendline created in the prior step. Enter a function in cell F4 to calculate the Slope of the linear trendline. Enter a function in cell G4 to calculate the R-square of the linear trendline. Enter a function in cell H4 to calculate the Standard Error. Use the FORECAST.LINEAR function in cell E7 to the total number of customers by the end of 2021. Complete your analysis by added formulas in the range F7:G7 to calculate the high and low thresholds of the forecast. Save and close Expl 9_Excel_ Ch08_ CapAssessment_EmployeeSatisfactionxlsx. Exit Excel. Submit the file as directed
Step by Step Solution
There are 3 Steps involved in it

Get step-by-step solutions from verified subject matter experts