

Question: Enter appropriate formulas into the following cell ranges to complete the model: B69..G70 K75, K77, K78 J76..K76, J79..K79, J81..K81 J83..K86, J88..K89, J91..K92 J94..K95, J97..K97 r
Enter appropriate formulas into the following cell ranges to complete the model:
B69..G70
K75, K77, K78
J76..K76,
J79..K79,
J81..K81
J83..K86,
J88..K89,
J91..K92
J94..K95,
J97..K97
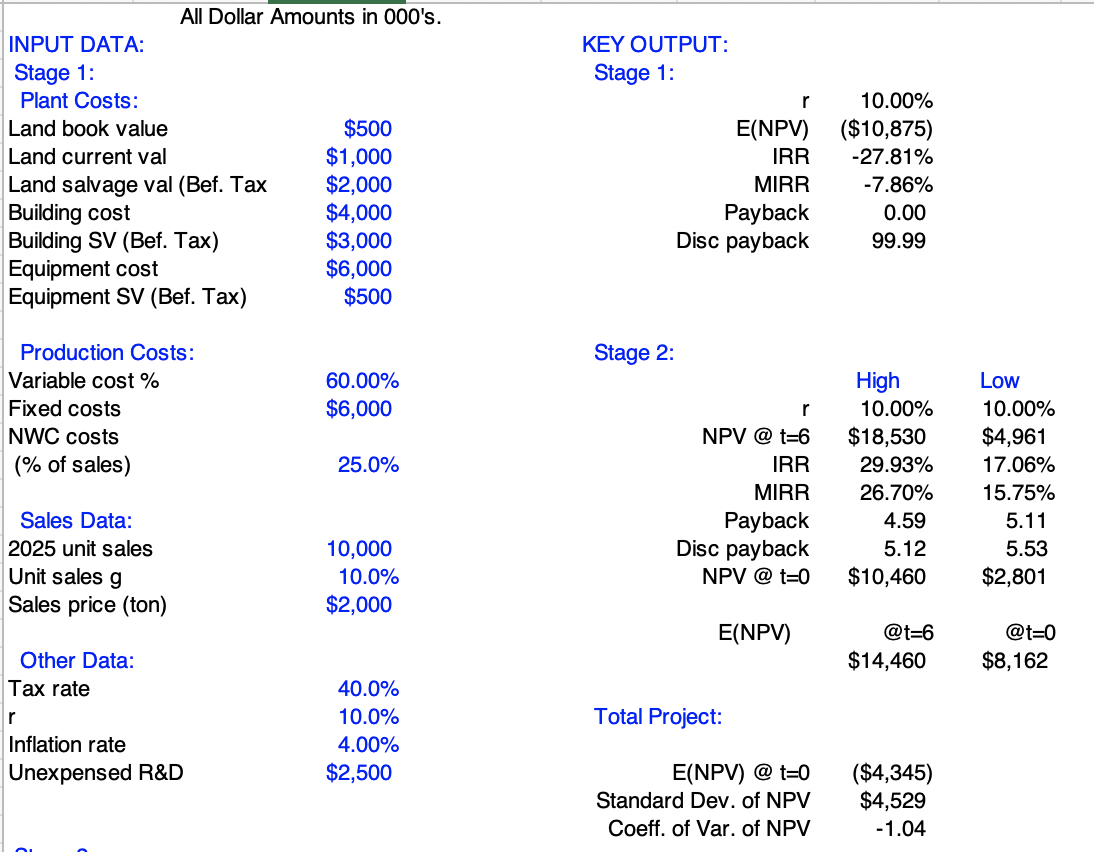
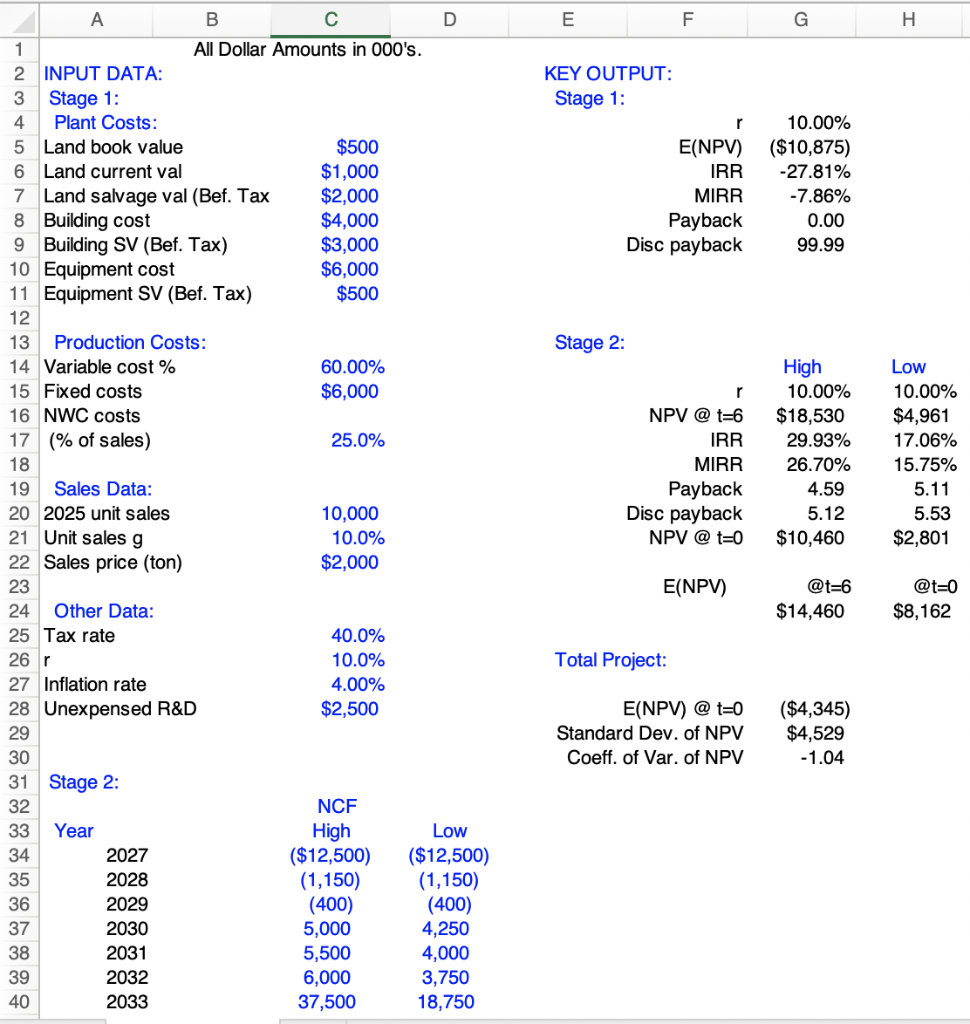
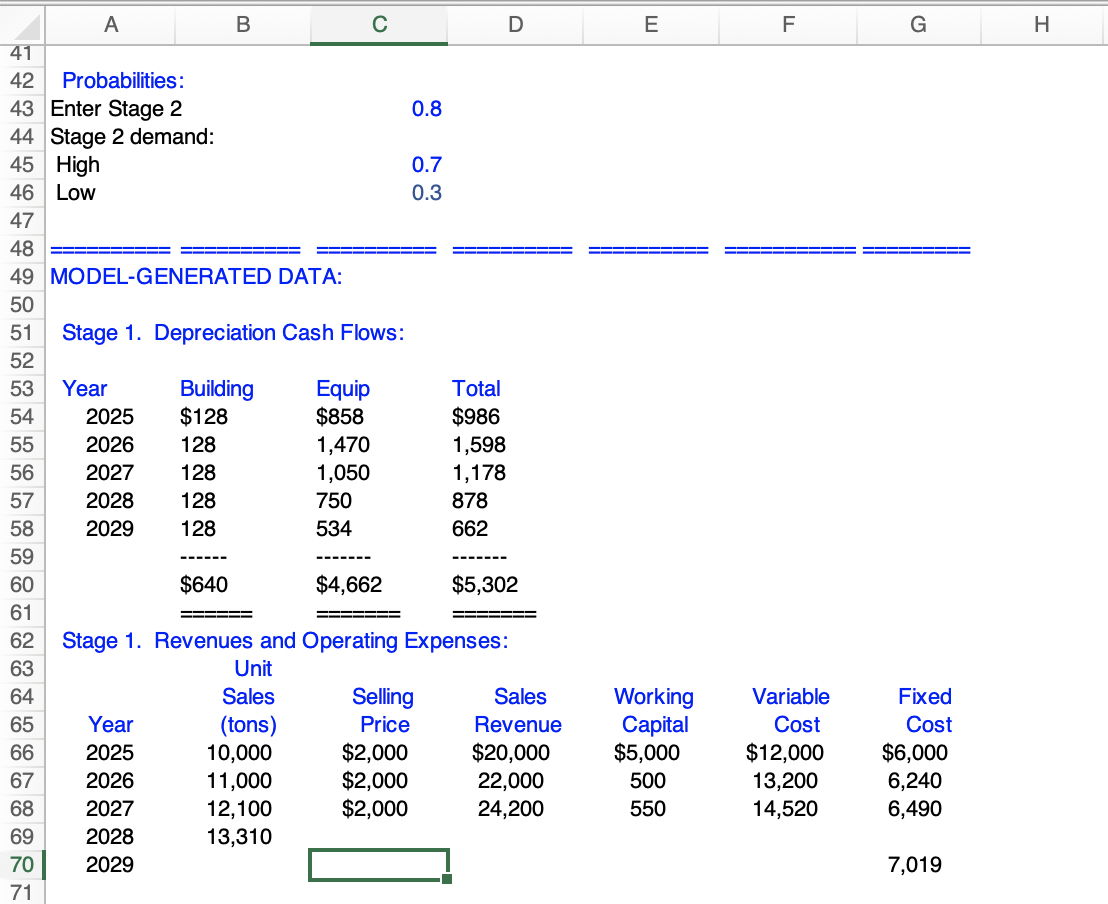
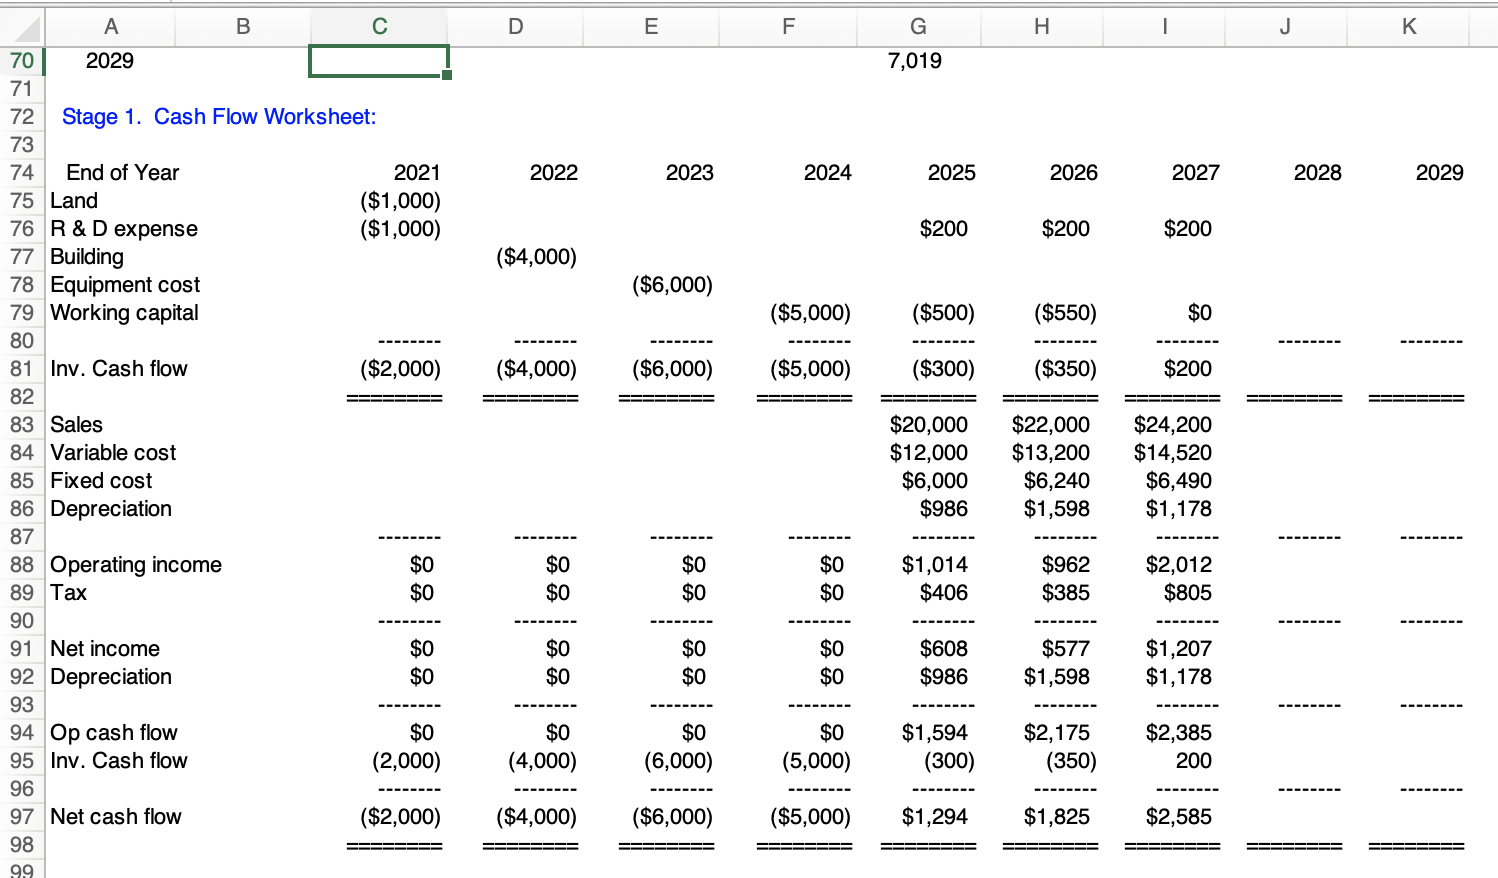
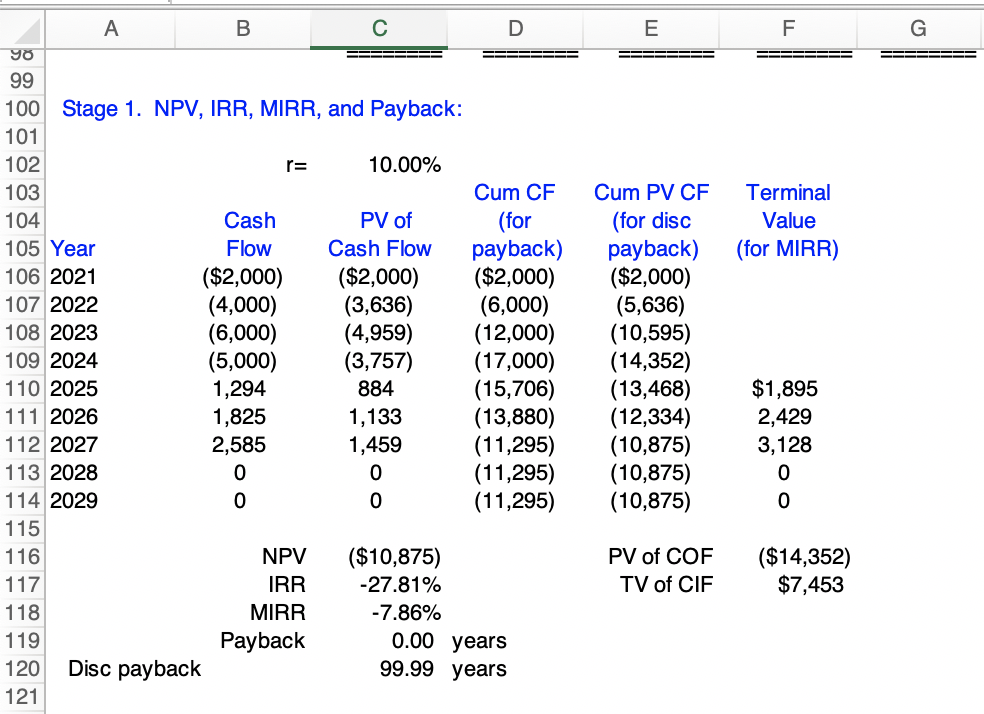
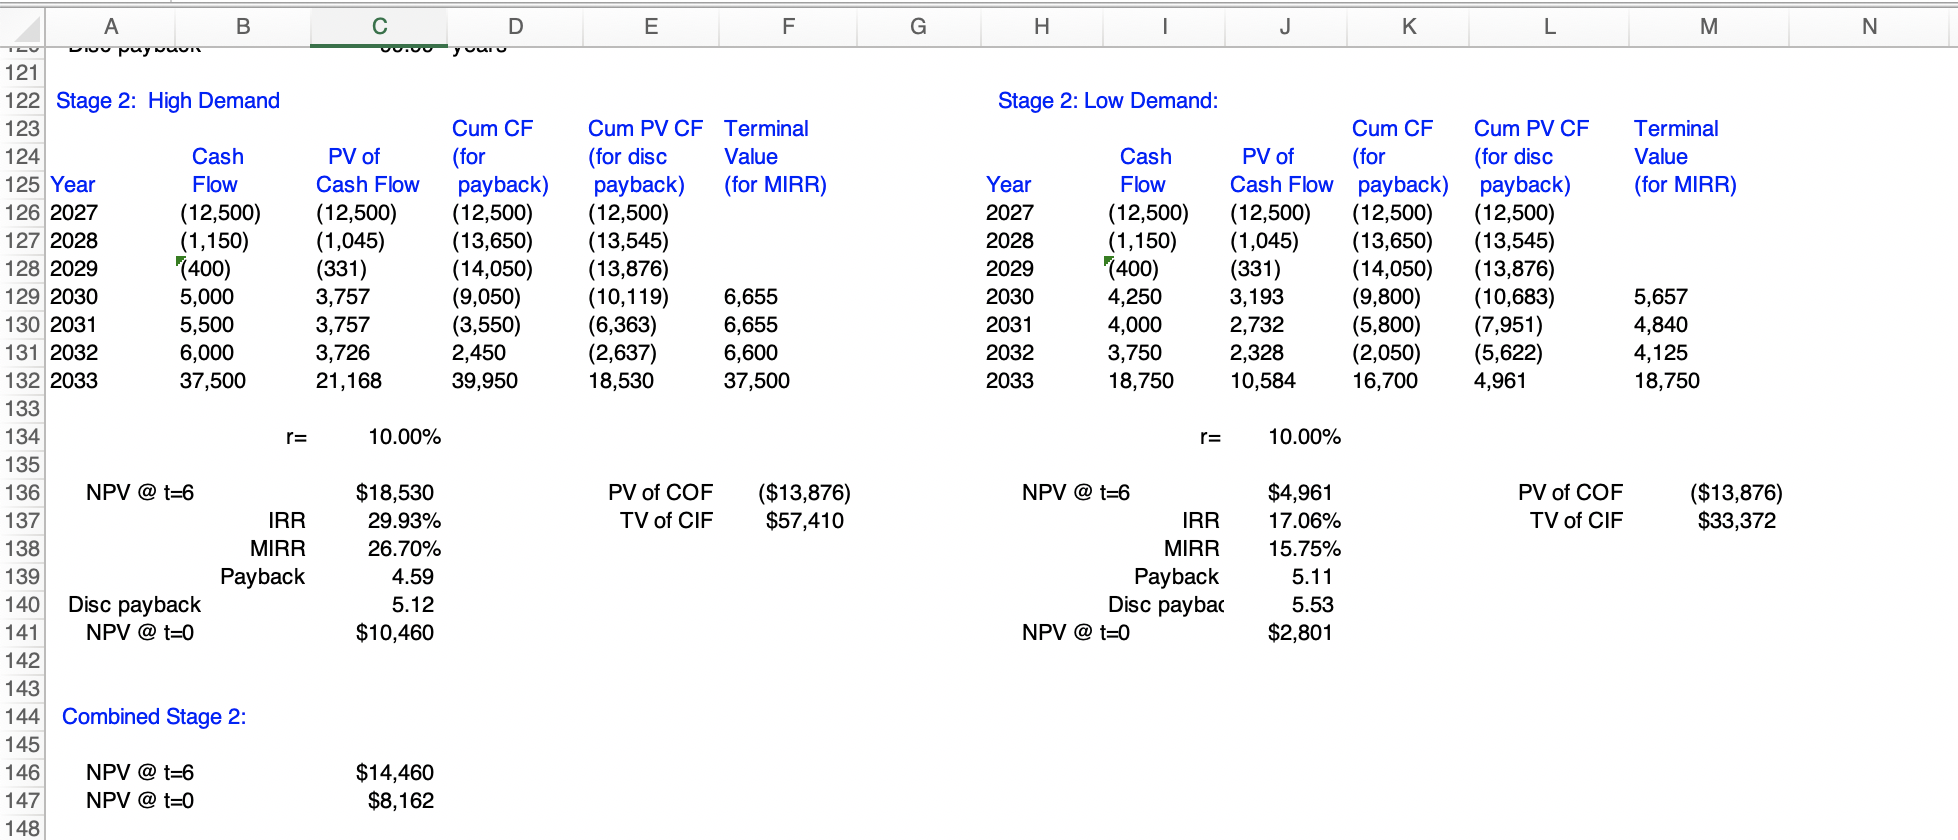
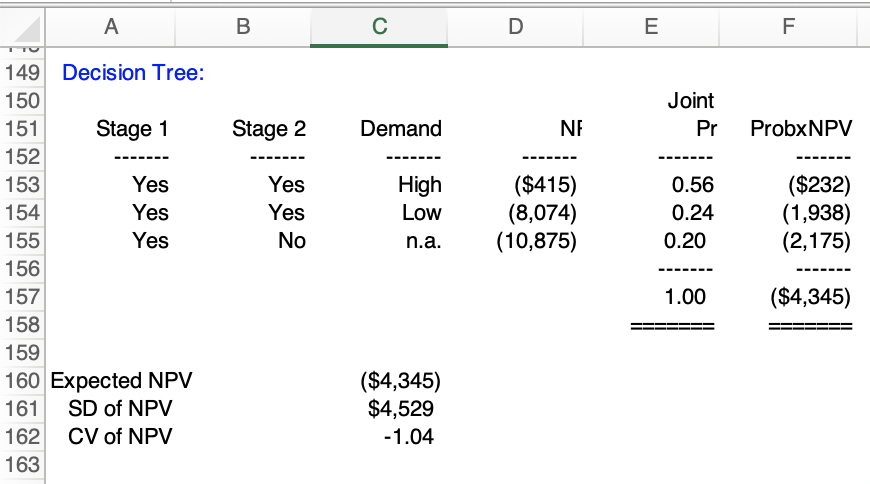
r All Dollar Amounts in 000's. INPUT DATA: Stage 1: Plant Costs: Land book value $500 Land current val $1,000 Land salvage val (Bef. Tax $2,000 Building cost $4,000 Building SV (Bef. Tax) $3,000 Equipment cost $6,000 Equipment SV (Bef. Tax) $500 KEY OUTPUT: Stage 1: 10.00% E(NPV) ($10,875) IRR -27.81% MIRR -7.86% Payback 0.00 Disc payback 99.99 Stage 2: Production Costs: Variable cost % Fixed costs NWC costs (% of sales) 60.00% $6,000 25.0% r NPV @t=6 IRR MIRR Payback Disc payback NPV @ t=0 High 10.00% $18,530 29.93% 26.70% 4.59 5.12 $10,460 Low 10.00% $4,961 17.06% 15.75% 5.11 5.53 $2,801 Sales Data: 2025 unit sales Unit sales g Sales price (ton) 10,000 10.0% $2,000 E(NPV) @t=6 $14,460 @t=0 $8,162 Other Data: Tax rate r Inflation rate Unexpensed R&D Total Project: 40.0% 10.0% 4.00% $2,500 E(NPV) @ t=0 Standard Dev. of NPV Coeff. of Var. of NPV ($4,345) $4,529 -1.04 E F G H KEY OUTPUT: Stage 1: r E(NPV) IRR MIRR Payback Disc payback 10.00% ($10,875) -27.81% -7.86% 0.00 99.99 Stage 2: A B D 1 All Dollar Amounts in 000's. 2 INPUT DATA: 3 Stage 1: 4 Plant Costs: 5 Land book value $500 6 Land current val $1,000 7 Land salvage val (Bef. Tax $2,000 8 Building cost $4,000 9 Building SV (Bef. Tax) $3,000 10 Equipment cost $6,000 11 Equipment SV (Bef. Tax) $500 12 13 Production Costs: 14 Variable costs 60.00% 15 Fixed costs $6,000 16 NWC costs 17 (% of sales) 25.0% 18 19 Sales Data: 20 2025 unit sales 10,000 21 Unit sales g 10.0% 22 Sales price (ton) $2,000 23 24 Other Data: 25 Tax rate 40.0% 26r 10.0% 27 Inflation rate 4.00% 28 Unexpensed R&D $2,500 29 30 31 Stage 2: 32 NCF 33 Year High Low 34 2027 ($12,500) ($12,500) 35 2028 (1,150) (1,150) 36 2029 (400) (400) 37 2030 5,000 4,250 38 2031 5,500 4,000 39 2032 6,000 3,750 40 2033 37,500 18,750 r NPV @t=6 IRR MIRR Payback Disc payback NPV @ t=0 High 10.00% $18,530 29.93% 26.70% 4.59 5.12 $10,460 Low 10.00% $4,961 17.06% 15.75% 5.11 5.53 $2,801 E(NPV) @t=6 $14,460 @t=0 $8,162 Total Project: E(NPV) @ t=0 Standard Dev. of NPV Coeff. of Var. of NPV ($4,345) $4,529 - 1.04 E F. G H 0.3 ES A B 41 42 Probabilities: 43 Enter Stage 2 0.8 44 Stage 2 demand: 45 High 0.7 46 Low 47 48 49 MODEL-GENERATED DATA: 50 51 Stage 1. Depreciation Cash Flows: 52 53 Year Building Equip Total 54 2025 $128 $858 $986 55 2026 128 1,470 1,598 56 2027 128 1,050 1,178 57 2028 128 750 878 58 2029 128 534 662 59 60 $640 $4,662 $5,302 61 62 Stage 1. Revenues and Operating Expenses: 63 Unit 64 Sales Selling Sales 65 Year (tons) Price Revenue 66 2025 10,000 $2,000 $20,000 67 2026 11,000 $2,000 22,000 68 2027 12,100 $2,000 24,200 69 2028 13,310 70 2029 71 Working Capital $5,000 500 550 Variable Cost $12,000 13,200 14,520 Fixed Cost $6,000 6,240 6,490 7,019 A B D E F G H 1 J K 7,019 2022 2023 2024 2025 2026 2027 2028 2029 $200 $200 $200 ($4,000) ($6,000) ($5,000) ($500) ($550) $0 ($4,000) ($6,000) ($5,000) ($300) ($350) $200 70 2029 71 72 Stage 1. Cash Flow Worksheet: 73 74 End of Year 2021 75 Land ($1,000) 76 R & D expense ($1,000) 77 Building 78 Equipment cost 79 Working capital 80 81 Inv. Cash flow ($2,000) 82 83 Sales 84 Variable cost 85 Fixed cost 86 Depreciation 87 88 Operating income $0 89 Tax $0 90 91 Net income $0 92 Depreciation $0 93 94 Op cash flow $0 95 Inv. Cash flow (2,000) 96 97 Net cash flow ($2,000) 98 99 $20,000 $12,000 $6,000 $986 $22,000 $13,200 $6,240 $1,598 $24,200 $14,520 $6,490 $1,178 $0 $0 $0 $0 $0 $0 $1,014 $406 $962 $385 $2,012 $805 $0 $0 $0 $0 $0 $0 $608 $986 $577 $1,598 $1,207 $1,178 $0 (4,000) $0 (6,000) $0 (5,000) $1,594 (300) $2,175 (350) $2,385 200 ($4,000) ($6,000) ($5,000) $1,294 $1,825 $2,585 ======== ======== ======== E F G === Terminal Value (for MIRR) A B D 90 99 100 Stage 1. NPV, IRR, MIRR, and Payback: 101 102 r= 10.00% 103 Cum CF 104 Cash PV of (for 105 Year Flow Cash Flow payback) 106 2021 ($2,000) ($2,000) ($2,000) 107 2022 (4,000) (3,636) (6,000) 108 2023 (6,000) (4,959) (12,000) 109 2024 (5,000) (3,757) (17,000) 110 2025 1,294 884 (15,706) 111 2026 1,825 1,133 (13,880) 112 2027 2,585 1,459 (11,295) 113 2028 0 0 (11,295) 114 2029 0 (11,295) 115 116 NPV ($10,875) 117 IRR -27.81% 118 MIRR -7.86% 119 Payback 120 Disc payback 99.99 years 121 Cum PV CF (for disc payback) ($2,000) (5,636) (10,595) (14,352) (13,468) (12,334) (10,875) (10,875) (10,875) $1,895 2,429 3,128 0 0 PV of COF TV of CIF ($14,352) $7,453 0.00 years E F G H 1 J K L Domov M N yuu Stage 2: Low Demand: Terminal Value (for MIRR) Cum PV CF Terminal (for disc Value payback) (for MIRR) (12,500) (13,545) (13,876) (10,119) 6,655 (6,363) 6,655 (2,637) 6,600 18,530 37,500 Year 2027 2028 2029 2030 2031 2032 2033 Cash Flow (12,500) (1,150) "(400) 4,250 4,000 3,750 18,750 Cum CF Cum PV CF PV of (for (for disc Cash Flow payback) payback) (12,500) (12,500) (12,500) (1,045) (13,650) (13,545) (331) (14,050) (13,876) 3,193 (9,800) (10,683) 2,732 (5,800) (7,951) 2,328 (2,050) (5,622) 10,584 16,700 4,961 5,657 4,840 4,125 18,750 B D ov puyuuun 121 122 Stage 2: High Demand 123 Cum CF 124 Cash PV of (for 125 Year Flow Cash Flow payback) 126 2027 (12,500) (12,500) (12,500) 127 2028 (1,150) (1,045) (13,650) 128 2029 (400) (331) (14,050) 129 2030 5,000 3,757 (9,050) 130 2031 5,500 3,757 (3,550) 131 2032 6,000 3,726 2,450 132 2033 37,500 21,168 39,950 133 134 r= 10.00% 135 136 NPV @t=6 $18,530 137 IRR 29.93% 138 MIRR 26.70% 139 Payback 4.59 140 Disc payback 5.12 141 NPV @ t=0 $10,460 142 143 144 Combined Stage 2: 145 146 NPV @t=6 $14,460 147 NPV @ t=0 $8,162 148 r= 10.00% PV of COF TV of CIF ($13,876) $57,410 PV of COF TV of CIF ($13,876) $33,372 NPV @t=6 IRR MIRR Payback Disc paybac NPV @ t=0 $4,961 17.06% 15.75% 5.11 5.53 $2,801 A B D E F Joint Pr Stage 2 Demand NE ProbxNPV Yes Yes Yes No High Low n.a. ($415) (8,074) (10,875) 0.56 0.24 0.20 ($232) (1,938) (2,175) 149 Decision Tree: 150 151 Stage 1 152 153 154 Yes 155 Yes 156 157 158 159 160 Expected NPV 161 SD of NPV 162 CV of NPV 163 1.00 ($4,345) ($4,345) $4,529 -1.04 r All Dollar Amounts in 000's. INPUT DATA: Stage 1: Plant Costs: Land book value $500 Land current val $1,000 Land salvage val (Bef. Tax $2,000 Building cost $4,000 Building SV (Bef. Tax) $3,000 Equipment cost $6,000 Equipment SV (Bef. Tax) $500 KEY OUTPUT: Stage 1: 10.00% E(NPV) ($10,875) IRR -27.81% MIRR -7.86% Payback 0.00 Disc payback 99.99 Stage 2: Production Costs: Variable cost % Fixed costs NWC costs (% of sales) 60.00% $6,000 25.0% r NPV @t=6 IRR MIRR Payback Disc payback NPV @ t=0 High 10.00% $18,530 29.93% 26.70% 4.59 5.12 $10,460 Low 10.00% $4,961 17.06% 15.75% 5.11 5.53 $2,801 Sales Data: 2025 unit sales Unit sales g Sales price (ton) 10,000 10.0% $2,000 E(NPV) @t=6 $14,460 @t=0 $8,162 Other Data: Tax rate r Inflation rate Unexpensed R&D Total Project: 40.0% 10.0% 4.00% $2,500 E(NPV) @ t=0 Standard Dev. of NPV Coeff. of Var. of NPV ($4,345) $4,529 -1.04 E F G H KEY OUTPUT: Stage 1: r E(NPV) IRR MIRR Payback Disc payback 10.00% ($10,875) -27.81% -7.86% 0.00 99.99 Stage 2: A B D 1 All Dollar Amounts in 000's. 2 INPUT DATA: 3 Stage 1: 4 Plant Costs: 5 Land book value $500 6 Land current val $1,000 7 Land salvage val (Bef. Tax $2,000 8 Building cost $4,000 9 Building SV (Bef. Tax) $3,000 10 Equipment cost $6,000 11 Equipment SV (Bef. Tax) $500 12 13 Production Costs: 14 Variable costs 60.00% 15 Fixed costs $6,000 16 NWC costs 17 (% of sales) 25.0% 18 19 Sales Data: 20 2025 unit sales 10,000 21 Unit sales g 10.0% 22 Sales price (ton) $2,000 23 24 Other Data: 25 Tax rate 40.0% 26r 10.0% 27 Inflation rate 4.00% 28 Unexpensed R&D $2,500 29 30 31 Stage 2: 32 NCF 33 Year High Low 34 2027 ($12,500) ($12,500) 35 2028 (1,150) (1,150) 36 2029 (400) (400) 37 2030 5,000 4,250 38 2031 5,500 4,000 39 2032 6,000 3,750 40 2033 37,500 18,750 r NPV @t=6 IRR MIRR Payback Disc payback NPV @ t=0 High 10.00% $18,530 29.93% 26.70% 4.59 5.12 $10,460 Low 10.00% $4,961 17.06% 15.75% 5.11 5.53 $2,801 E(NPV) @t=6 $14,460 @t=0 $8,162 Total Project: E(NPV) @ t=0 Standard Dev. of NPV Coeff. of Var. of NPV ($4,345) $4,529 - 1.04 E F. G H 0.3 ES A B 41 42 Probabilities: 43 Enter Stage 2 0.8 44 Stage 2 demand: 45 High 0.7 46 Low 47 48 49 MODEL-GENERATED DATA: 50 51 Stage 1. Depreciation Cash Flows: 52 53 Year Building Equip Total 54 2025 $128 $858 $986 55 2026 128 1,470 1,598 56 2027 128 1,050 1,178 57 2028 128 750 878 58 2029 128 534 662 59 60 $640 $4,662 $5,302 61 62 Stage 1. Revenues and Operating Expenses: 63 Unit 64 Sales Selling Sales 65 Year (tons) Price Revenue 66 2025 10,000 $2,000 $20,000 67 2026 11,000 $2,000 22,000 68 2027 12,100 $2,000 24,200 69 2028 13,310 70 2029 71 Working Capital $5,000 500 550 Variable Cost $12,000 13,200 14,520 Fixed Cost $6,000 6,240 6,490 7,019 A B D E F G H 1 J K 7,019 2022 2023 2024 2025 2026 2027 2028 2029 $200 $200 $200 ($4,000) ($6,000) ($5,000) ($500) ($550) $0 ($4,000) ($6,000) ($5,000) ($300) ($350) $200 70 2029 71 72 Stage 1. Cash Flow Worksheet: 73 74 End of Year 2021 75 Land ($1,000) 76 R & D expense ($1,000) 77 Building 78 Equipment cost 79 Working capital 80 81 Inv. Cash flow ($2,000) 82 83 Sales 84 Variable cost 85 Fixed cost 86 Depreciation 87 88 Operating income $0 89 Tax $0 90 91 Net income $0 92 Depreciation $0 93 94 Op cash flow $0 95 Inv. Cash flow (2,000) 96 97 Net cash flow ($2,000) 98 99 $20,000 $12,000 $6,000 $986 $22,000 $13,200 $6,240 $1,598 $24,200 $14,520 $6,490 $1,178 $0 $0 $0 $0 $0 $0 $1,014 $406 $962 $385 $2,012 $805 $0 $0 $0 $0 $0 $0 $608 $986 $577 $1,598 $1,207 $1,178 $0 (4,000) $0 (6,000) $0 (5,000) $1,594 (300) $2,175 (350) $2,385 200 ($4,000) ($6,000) ($5,000) $1,294 $1,825 $2,585 ======== ======== ======== E F G === Terminal Value (for MIRR) A B D 90 99 100 Stage 1. NPV, IRR, MIRR, and Payback: 101 102 r= 10.00% 103 Cum CF 104 Cash PV of (for 105 Year Flow Cash Flow payback) 106 2021 ($2,000) ($2,000) ($2,000) 107 2022 (4,000) (3,636) (6,000) 108 2023 (6,000) (4,959) (12,000) 109 2024 (5,000) (3,757) (17,000) 110 2025 1,294 884 (15,706) 111 2026 1,825 1,133 (13,880) 112 2027 2,585 1,459 (11,295) 113 2028 0 0 (11,295) 114 2029 0 (11,295) 115 116 NPV ($10,875) 117 IRR -27.81% 118 MIRR -7.86% 119 Payback 120 Disc payback 99.99 years 121 Cum PV CF (for disc payback) ($2,000) (5,636) (10,595) (14,352) (13,468) (12,334) (10,875) (10,875) (10,875) $1,895 2,429 3,128 0 0 PV of COF TV of CIF ($14,352) $7,453 0.00 years E F G H 1 J K L Domov M N yuu Stage 2: Low Demand: Terminal Value (for MIRR) Cum PV CF Terminal (for disc Value payback) (for MIRR) (12,500) (13,545) (13,876) (10,119) 6,655 (6,363) 6,655 (2,637) 6,600 18,530 37,500 Year 2027 2028 2029 2030 2031 2032 2033 Cash Flow (12,500) (1,150) "(400) 4,250 4,000 3,750 18,750 Cum CF Cum PV CF PV of (for (for disc Cash Flow payback) payback) (12,500) (12,500) (12,500) (1,045) (13,650) (13,545) (331) (14,050) (13,876) 3,193 (9,800) (10,683) 2,732 (5,800) (7,951) 2,328 (2,050) (5,622) 10,584 16,700 4,961 5,657 4,840 4,125 18,750 B D ov puyuuun 121 122 Stage 2: High Demand 123 Cum CF 124 Cash PV of (for 125 Year Flow Cash Flow payback) 126 2027 (12,500) (12,500) (12,500) 127 2028 (1,150) (1,045) (13,650) 128 2029 (400) (331) (14,050) 129 2030 5,000 3,757 (9,050) 130 2031 5,500 3,757 (3,550) 131 2032 6,000 3,726 2,450 132 2033 37,500 21,168 39,950 133 134 r= 10.00% 135 136 NPV @t=6 $18,530 137 IRR 29.93% 138 MIRR 26.70% 139 Payback 4.59 140 Disc payback 5.12 141 NPV @ t=0 $10,460 142 143 144 Combined Stage 2: 145 146 NPV @t=6 $14,460 147 NPV @ t=0 $8,162 148 r= 10.00% PV of COF TV of CIF ($13,876) $57,410 PV of COF TV of CIF ($13,876) $33,372 NPV @t=6 IRR MIRR Payback Disc paybac NPV @ t=0 $4,961 17.06% 15.75% 5.11 5.53 $2,801 A B D E F Joint Pr Stage 2 Demand NE ProbxNPV Yes Yes Yes No High Low n.a. ($415) (8,074) (10,875) 0.56 0.24 0.20 ($232) (1,938) (2,175) 149 Decision Tree: 150 151 Stage 1 152 153 154 Yes 155 Yes 156 157 158 159 160 Expected NPV 161 SD of NPV 162 CV of NPV 163 1.00 ($4,345) ($4,345) $4,529 -1.04
Step by Step Solution
There are 3 Steps involved in it

Get step-by-step solutions from verified subject matter experts