

Question: enter data in excel and graph the followong functions/curves. average fixed cost average variable cost average total cost marginal cost marginal revenue TABLE 9-2 Illustration
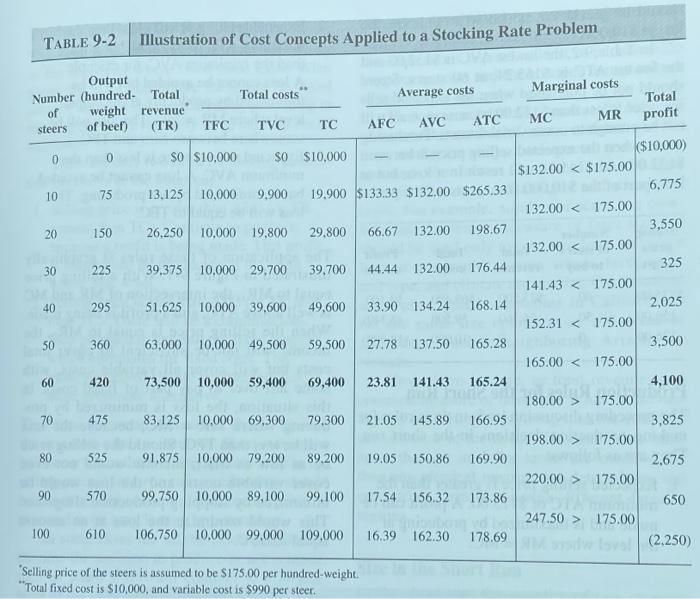
TABLE 9-2 Illustration of Cost Concepts Applied to a Stocking Rate Problem Marginal costs Total costs Average costs Output Number (hundred- Total of weight revenue steers of beel) (TR) Total profit MR TFC MC TVC AFC TC AVC ATC 0 0 SO $10,000 $0 $10,000 10 75 13.125 10,000 9.900 19,900 $133.33 $132.00 $265.33 20 150 26,250 10.000 19.800 29,800 67 132.00 198.67 30 225 39.375 10.000 29.700 39,700 44.44 132.00 176,44 40 295 51.625 10,000 39.600 49,600 33.90 134.24 168.14 50 360 63,000 10,000 49,500 59,500 27.78 137.50 165.28 ($10,000) $132.00 175.00 2,675 220.00 > 175.00 650 247.50 > 175.00 (2,250) 60 420 73,500 10,000 59,400 69,400 23.81 141.43 165.24 70 475 83,125 10,000 69,300 79,300 21.05 145.89 166.95 80 525 91.875 10.000 79.200 89.200 19.05 150.86 169.90 90 570 99,750 10,000 89,100 99,100 17.54 156.32 173.86 100 610 106.750 10.000 99.000 109,000 16.39 162.30 178.69 Selling price of the steers is assumed to be $175.00 per hundred-weight **Total fixed cost is $10,000, and variable cost is $990 per steer
Step by Step Solution
There are 3 Steps involved in it

Get step-by-step solutions from verified subject matter experts