

Question: Enter following Matlab codes into editor and run to get answer and Figures. Attach Publish copy with answer including %% your name and Exam2 Problem
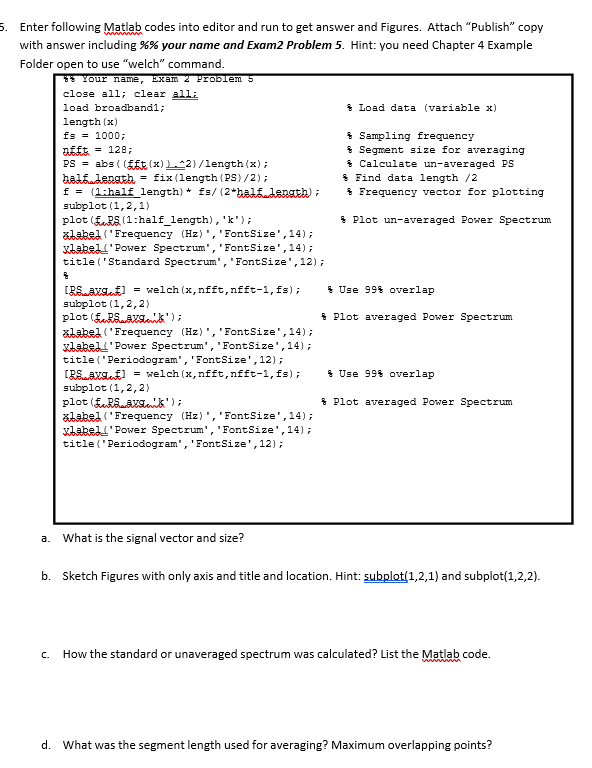
Enter following Matlab codes into editor and run to get answer and Figures. Attach "Publish" copy with answer including \%\% your name and Exam2 Problem 5. Hint: you need Chapter 4 Example Folder open to use "welch" command. a. What is the signal vector and size? b. Sketch Figures with only axis and title and location. Hint: subplot (1,2,1) and subplot (1,2,2). c. How the standard or unaveraged spectrum was calculated? List the Matlab code. d. What was the segment length used for averaging? Maximum overlapping points
Step by Step Solution
There are 3 Steps involved in it
1 Expert Approved Answer
Step: 1 Unlock

Question Has Been Solved by an Expert!
Get step-by-step solutions from verified subject matter experts
Step: 2 Unlock
Step: 3 Unlock