

Question: - Enter inputs in empty cells in the balance sheet (G25 and G35). - Calculate the % change (yellow highlighted cells) as (ending value -
- Enter inputs in empty cells in the balance sheet (G25 and G35). - Calculate the % change (yellow highlighted cells) as (ending value - beginning value) / beginning value. F47 has been calculated for you as an example. - Using historical financial ratios, judge Apex's performance. Hint for getting started: See sample table in the Ratio Interpretation tab as a quick reference on how to interpret the % change to guide your analysis. Then add your comments below each header (Profitability, Leverage, etc.) 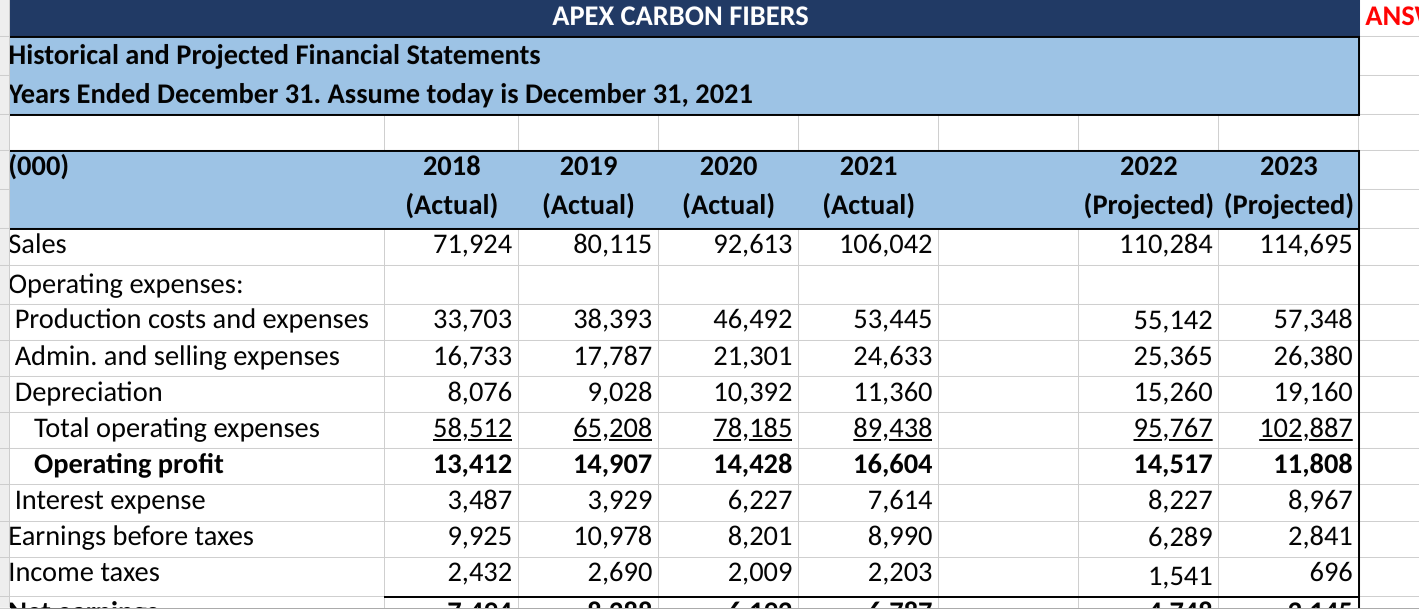
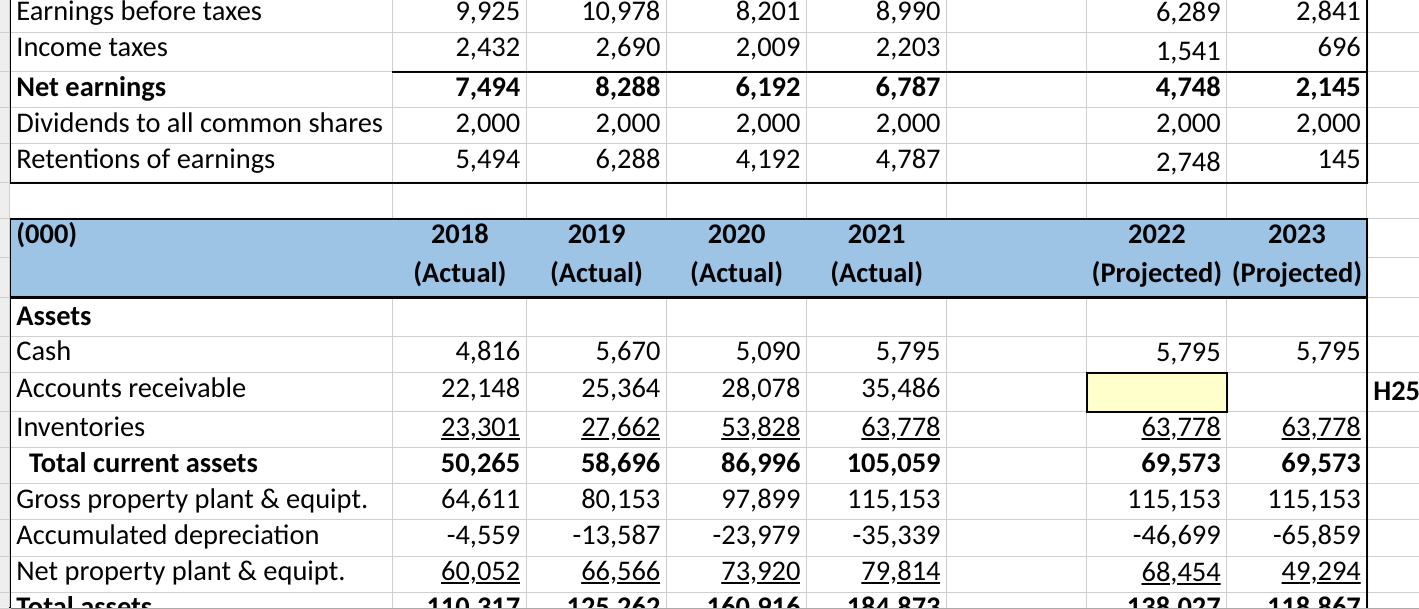
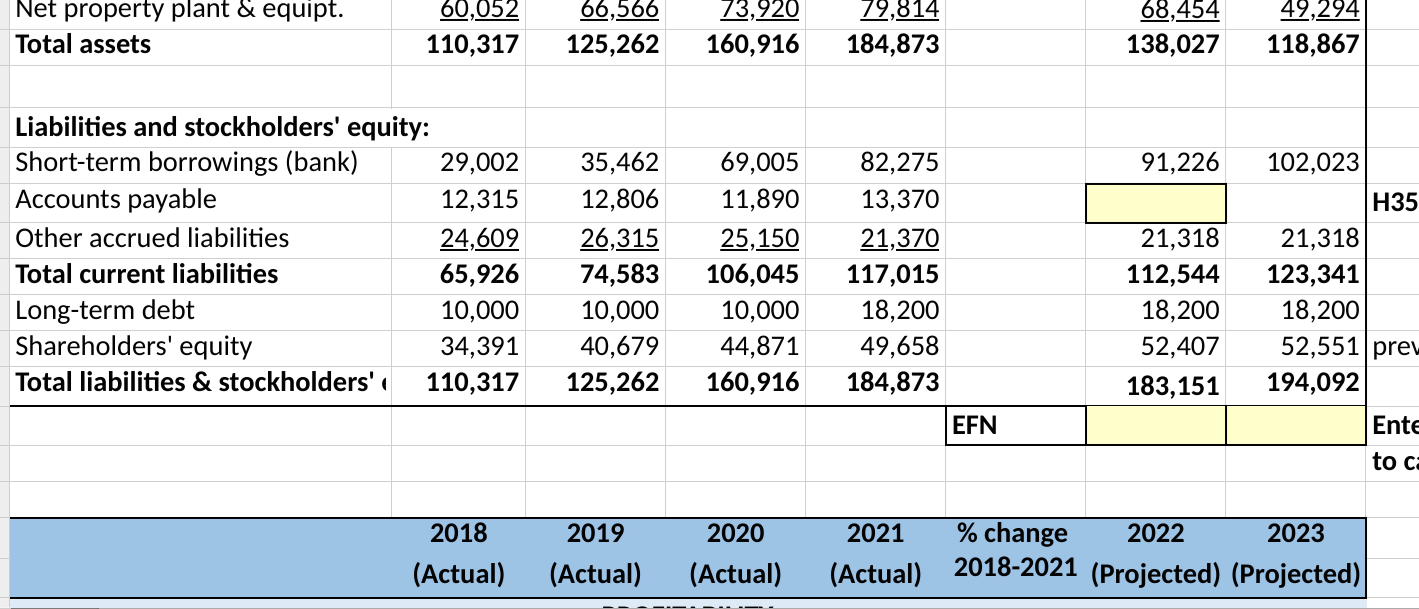
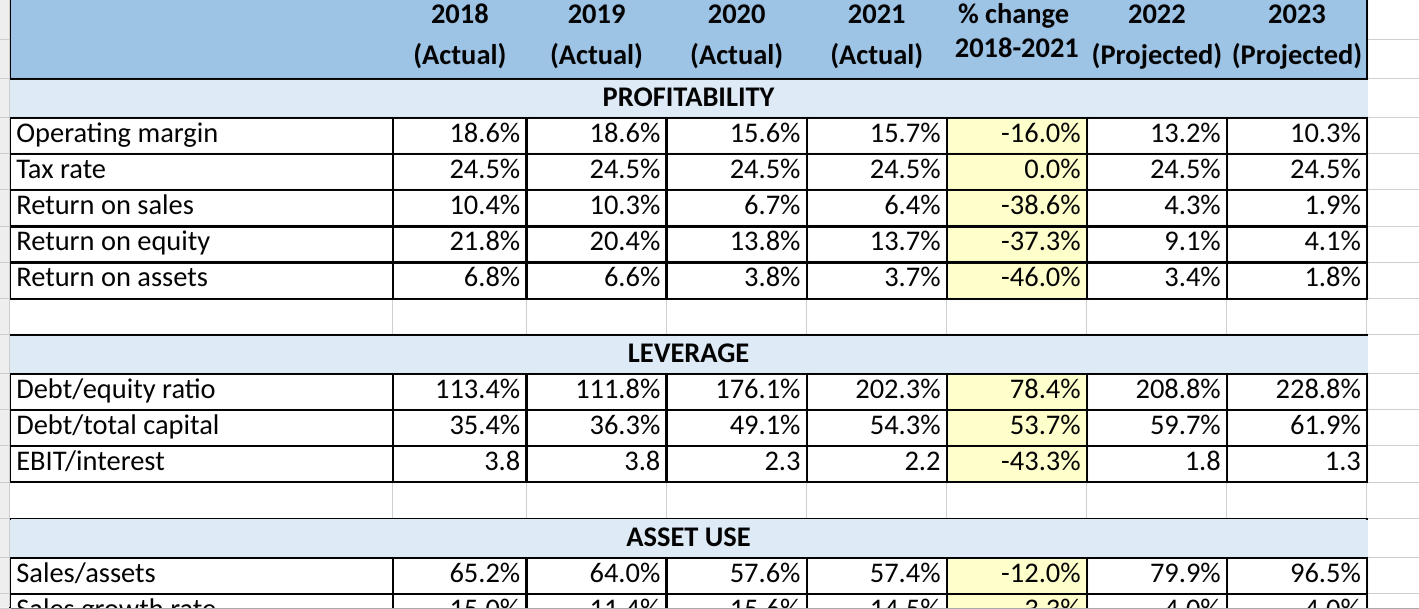
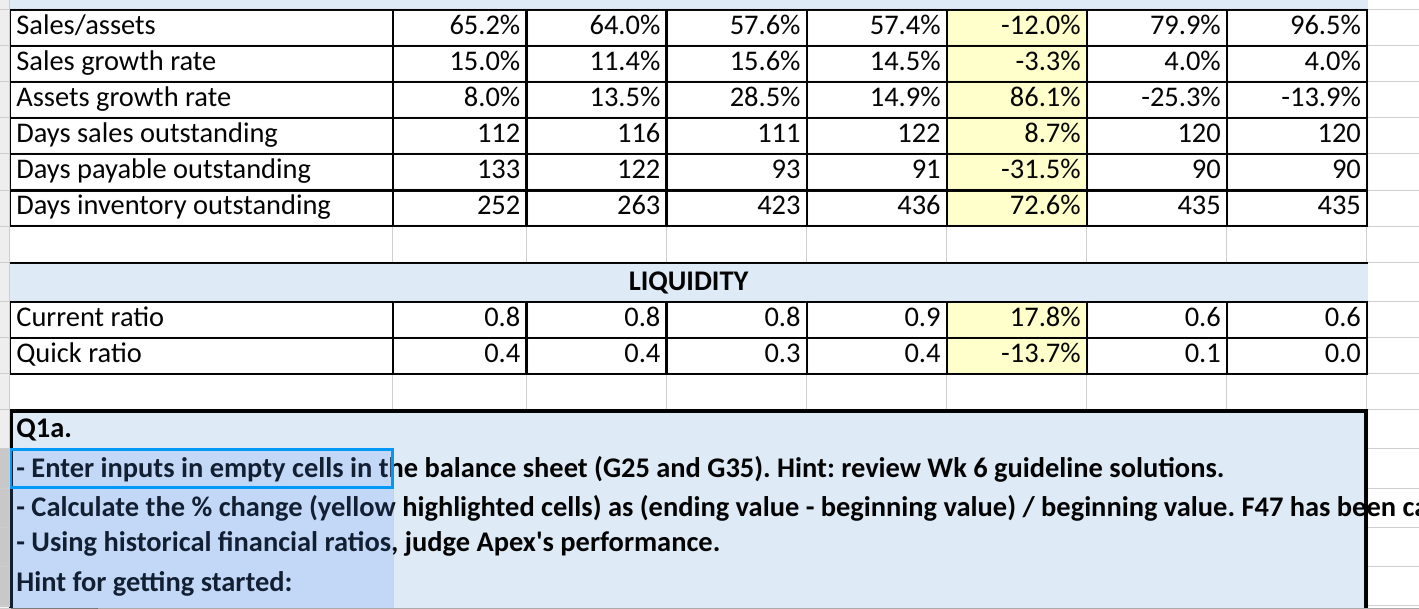
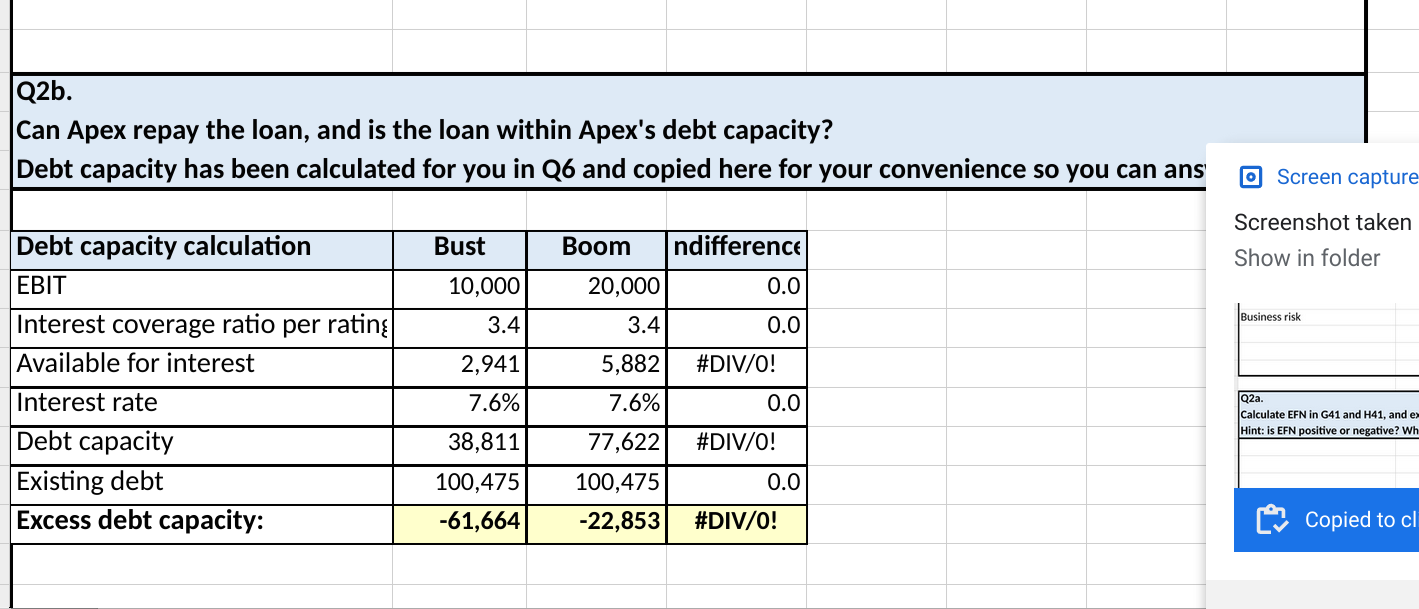
ANS APEX CARBON FIBERS Historical and Projected Financial Statements Years Ended December 31. Assume today is December 31, 2021 (000) 2018 (Actual) 71,924 2019 (Actual) 80,115 2020 (Actual) 92,613 2021 (Actual) 106,042 2022 2023 (Projected) (Projected) 110,284 114,695 Sales Operating expenses: Production costs and expenses Admin. and selling expenses Depreciation Total operating expenses Operating profit Interest expense Earnings before taxes Income taxes 33,703 16,733 8,076 58,512 13,412 3,487 9,925 2,432 38,393 17,787 9,028 65,208 14,907 3,929 10,978 2,690 46,492 21,301 10,392 78,185 14,428 6,227 8,201 2,009 53,445 24,633 11,360 89,438 16,604 7,614 8,990 2,203 55,142 25,365 15,260 95,767 14,517 8,227 6,289 1,541 57,348 26,380 19,160 102,887 11,808 8,967 2,841 696 ANA nann Ann ZA 2,841 696 Earnings before taxes Income taxes Net earnings Dividends to all common shares Retentions of earnings 9,925 2,432 7,494 2,000 5,494 10,978 2,690 8,288 2,000 6,288 8,201 2,009 6,192 2,000 4,192 8,990 2,203 6,787 2,000 4,787 6,289 1,541 4,748 2,000 2,748 2,145 2,000 145 (000) 2018 (Actual) 2019 (Actual) 2020 (Actual) 2021 (Actual) 2022 2023 (Projected) (Projected) 5,795 Assets Cash Accounts receivable Inventories Total current assets Gross property plant & equipt. Accumulated depreciation Net property plant & equipt. 4,816 22,148 23,301 50,265 64,611 -4,559 60,052 5,670 25,364 27,662 58,696 80,153 -13,587 66,566 5,090 28,078 53,828 86,996 97,899 -23,979 73,920 5,795 35,486 63,778 105,059 115,153 -35,339 79,814 63,778 69,573 115,153 -46,699 68,454 5,795 H25 63,778 69,573 115,153 -65,859 49,294 Tatalaccate 110 217 125262 160016 104 072 120027 110067 Net property plant & equipt. Total assets 60,052 110,317 66,566 125,262 73,920 160,916 79,814 184,873 68,454 138,027 49,294 118,867 91,226 Liabilities and stockholders' equity: Short-term borrowings (bank) 29,002 Accounts payable 12,315 Other accrued liabilities 24,609 Total current liabilities 65,926 Long-term debt 10,000 Shareholders' equity 34,391 Total liabilities & stockholders' 110,317 35,462 12,806 26,315 74,583 10,000 40,679 125,262 69,005 11,890 25,150 106,045 10,000 44,871 160,916 82,275 13,370 21,370 117,015 18,200 49,658 184,873 EFN 21,318 112,544 18,200 52,407 183,151 102,023 H35 21,318 123,341 18,200 52,551 pre 194,092 Ente to 2020 2018 (Actual) 2019 (Actual) 2021 (Actual) % change 2022 2023 2018-2021 (Projected) (Projected) (Actual) 2018 2021 (Actual) % change 2022 2023 2018-2021 (Projected) (Projected) (Actual) Operating margin Tax rate Return on sales Return on equity Return on assets 18.6% 24.5% 10.4% 21.8% 6.8% 2019 2020 (Actual) (Actual) PROFITABILITY 18.6% 15.6% 24.5% 24.5% 10.3% 6.7% 20.4% 13.8% 6.6% 3.8% 15.7% 24.5% 6.4% 13.7% 3.7% -16.0% 0.0% -38.6% -37.3% -46.0% 13.2% 24.5% 4.3% 9.1% 3.4% 10.3% 24.5% 1.9% 4.1% 1.8% Debt/equity ratio Debt/total capital EBIT/interest 113.4% 35.4% 3.8 LEVERAGE 111.8% 176.1% 36.3% 49.1% 3.8 2.3 202.3% 54.3% 2.2 78.4% 53.7% -43.3% 208.8% 59.7% 1.8 228.8% 61.9% 1.3 ASSET USE 64.0% 57.6% Sales/assets 65.2% 57.4% -12.0% 79.9% 96.5% aranath rata 16 70/ 11 10/ 1020/ 1.4 0/ 0/ An0/ An0/ Sales/assets Sales growth rate Assets growth rate Days sales outstanding Days payable outstanding Days inventory outstanding 65.2% 15.0% 8.0% 112 133 252 64.0% 11.4% 13.5% 116 122 263 57.6% 15.6% 28.5% 111 57.4% 14.5% 14.9% 122 91 436 -12.0% -3.3% 86.1% 8.7% -31.5% 72.6% 79.9% 4.0% -25.3% 120 96.5% 4.0% -13.9% 120 93 90 90 435 423 435 0.8 LIQUIDITY 0.8 0.4 Current ratio Quick ratio 0.9 0.8 0.3 17.8% -13.7% 0.6 0.1 0.6 0.0 0.4 0.4. Q1a. - Enter inputs in empty cells in the balance sheet (G25 and G35). Hint: review Wk 6 guideline solutions. |- Calculate the % change (yellow highlighted cells) as (ending value - beginning value) / beginning value. F47 has been c - Using historical financial ratios, judge Apex's performance. Hint for getting started: - Liquidity Conclusion Q1b. What information would you need to appraise its business risk and financial risk? Do so to the extent possible. Financial risk Qla. - Enter inputs in empty cells in the balance sheet (G25 and G35). Hint: review Wk 6 guideline solutions. |- Calculate the % change (yellow highlighted cells) as (ending value - beginning value) / beginning value. F47 has been ca Using historical financial ratios, judge Apex's performance. Hint for getting started: See sample table in the Ratio Interpretation tab as a quick reference on how to interpret the % change to guide your an Then add your comments below each header (Profitability, Leverage, etc.) Profitability Leverage Business risk Q2a. Calculate EFN in G41 and H41, and explain the meaning of Apex's external financing needed (EFN)? Hint: is EFN positive or negative? What does it mean? Toch Q2b. Can Apex repay the loan, and is the loan within Apex's debt capacity? Debt capacity has been calculated for you in Q6 and copied here for your convenience so you can ans O Screen capture Bust Boom ndifference Screenshot taken Show in folder 10,000 20,000 0.0 Business risk 3.4 3.4. 0.0 2,941 5,882 #DIV/0! Debt capacity calculation EBIT Interest coverage ratio per rating | Available for interest Interest rate Debt capacity Existing debt Excess debt capacity: 7.6% 7.6% 0.0 Q2a. Calculate EFN in G41 and H41, and ex Hint: is EFN positive or negative? Wh 77,622 #DIV/0! 38,811 100,475 -61,664 0.0 100,475 -22,853 #DIV/0! Copied to cl ANS APEX CARBON FIBERS Historical and Projected Financial Statements Years Ended December 31. Assume today is December 31, 2021 (000) 2018 (Actual) 71,924 2019 (Actual) 80,115 2020 (Actual) 92,613 2021 (Actual) 106,042 2022 2023 (Projected) (Projected) 110,284 114,695 Sales Operating expenses: Production costs and expenses Admin. and selling expenses Depreciation Total operating expenses Operating profit Interest expense Earnings before taxes Income taxes 33,703 16,733 8,076 58,512 13,412 3,487 9,925 2,432 38,393 17,787 9,028 65,208 14,907 3,929 10,978 2,690 46,492 21,301 10,392 78,185 14,428 6,227 8,201 2,009 53,445 24,633 11,360 89,438 16,604 7,614 8,990 2,203 55,142 25,365 15,260 95,767 14,517 8,227 6,289 1,541 57,348 26,380 19,160 102,887 11,808 8,967 2,841 696 ANA nann Ann ZA 2,841 696 Earnings before taxes Income taxes Net earnings Dividends to all common shares Retentions of earnings 9,925 2,432 7,494 2,000 5,494 10,978 2,690 8,288 2,000 6,288 8,201 2,009 6,192 2,000 4,192 8,990 2,203 6,787 2,000 4,787 6,289 1,541 4,748 2,000 2,748 2,145 2,000 145 (000) 2018 (Actual) 2019 (Actual) 2020 (Actual) 2021 (Actual) 2022 2023 (Projected) (Projected) 5,795 Assets Cash Accounts receivable Inventories Total current assets Gross property plant & equipt. Accumulated depreciation Net property plant & equipt. 4,816 22,148 23,301 50,265 64,611 -4,559 60,052 5,670 25,364 27,662 58,696 80,153 -13,587 66,566 5,090 28,078 53,828 86,996 97,899 -23,979 73,920 5,795 35,486 63,778 105,059 115,153 -35,339 79,814 63,778 69,573 115,153 -46,699 68,454 5,795 H25 63,778 69,573 115,153 -65,859 49,294 Tatalaccate 110 217 125262 160016 104 072 120027 110067 Net property plant & equipt. Total assets 60,052 110,317 66,566 125,262 73,920 160,916 79,814 184,873 68,454 138,027 49,294 118,867 91,226 Liabilities and stockholders' equity: Short-term borrowings (bank) 29,002 Accounts payable 12,315 Other accrued liabilities 24,609 Total current liabilities 65,926 Long-term debt 10,000 Shareholders' equity 34,391 Total liabilities & stockholders' 110,317 35,462 12,806 26,315 74,583 10,000 40,679 125,262 69,005 11,890 25,150 106,045 10,000 44,871 160,916 82,275 13,370 21,370 117,015 18,200 49,658 184,873 EFN 21,318 112,544 18,200 52,407 183,151 102,023 H35 21,318 123,341 18,200 52,551 pre 194,092 Ente to 2020 2018 (Actual) 2019 (Actual) 2021 (Actual) % change 2022 2023 2018-2021 (Projected) (Projected) (Actual) 2018 2021 (Actual) % change 2022 2023 2018-2021 (Projected) (Projected) (Actual) Operating margin Tax rate Return on sales Return on equity Return on assets 18.6% 24.5% 10.4% 21.8% 6.8% 2019 2020 (Actual) (Actual) PROFITABILITY 18.6% 15.6% 24.5% 24.5% 10.3% 6.7% 20.4% 13.8% 6.6% 3.8% 15.7% 24.5% 6.4% 13.7% 3.7% -16.0% 0.0% -38.6% -37.3% -46.0% 13.2% 24.5% 4.3% 9.1% 3.4% 10.3% 24.5% 1.9% 4.1% 1.8% Debt/equity ratio Debt/total capital EBIT/interest 113.4% 35.4% 3.8 LEVERAGE 111.8% 176.1% 36.3% 49.1% 3.8 2.3 202.3% 54.3% 2.2 78.4% 53.7% -43.3% 208.8% 59.7% 1.8 228.8% 61.9% 1.3 ASSET USE 64.0% 57.6% Sales/assets 65.2% 57.4% -12.0% 79.9% 96.5% aranath rata 16 70/ 11 10/ 1020/ 1.4 0/ 0/ An0/ An0/ Sales/assets Sales growth rate Assets growth rate Days sales outstanding Days payable outstanding Days inventory outstanding 65.2% 15.0% 8.0% 112 133 252 64.0% 11.4% 13.5% 116 122 263 57.6% 15.6% 28.5% 111 57.4% 14.5% 14.9% 122 91 436 -12.0% -3.3% 86.1% 8.7% -31.5% 72.6% 79.9% 4.0% -25.3% 120 96.5% 4.0% -13.9% 120 93 90 90 435 423 435 0.8 LIQUIDITY 0.8 0.4 Current ratio Quick ratio 0.9 0.8 0.3 17.8% -13.7% 0.6 0.1 0.6 0.0 0.4 0.4. Q1a. - Enter inputs in empty cells in the balance sheet (G25 and G35). Hint: review Wk 6 guideline solutions. |- Calculate the % change (yellow highlighted cells) as (ending value - beginning value) / beginning value. F47 has been c - Using historical financial ratios, judge Apex's performance. Hint for getting started: - Liquidity Conclusion Q1b. What information would you need to appraise its business risk and financial risk? Do so to the extent possible. Financial risk Qla. - Enter inputs in empty cells in the balance sheet (G25 and G35). Hint: review Wk 6 guideline solutions. |- Calculate the % change (yellow highlighted cells) as (ending value - beginning value) / beginning value. F47 has been ca Using historical financial ratios, judge Apex's performance. Hint for getting started: See sample table in the Ratio Interpretation tab as a quick reference on how to interpret the % change to guide your an Then add your comments below each header (Profitability, Leverage, etc.) Profitability Leverage Business risk Q2a. Calculate EFN in G41 and H41, and explain the meaning of Apex's external financing needed (EFN)? Hint: is EFN positive or negative? What does it mean? Toch Q2b. Can Apex repay the loan, and is the loan within Apex's debt capacity? Debt capacity has been calculated for you in Q6 and copied here for your convenience so you can ans O Screen capture Bust Boom ndifference Screenshot taken Show in folder 10,000 20,000 0.0 Business risk 3.4 3.4. 0.0 2,941 5,882 #DIV/0! Debt capacity calculation EBIT Interest coverage ratio per rating | Available for interest Interest rate Debt capacity Existing debt Excess debt capacity: 7.6% 7.6% 0.0 Q2a. Calculate EFN in G41 and H41, and ex Hint: is EFN positive or negative? Wh 77,622 #DIV/0! 38,811 100,475 -61,664 0.0 100,475 -22,853 #DIV/0! Copied to cl
Step by Step Solution
There are 3 Steps involved in it

Get step-by-step solutions from verified subject matter experts