

Question: Enter Subject Revenue or Earnings Selected Multiple Value Valuation Adjustment for Excess or Non Operating Items 100% Control Value Value after First Premium / Discount
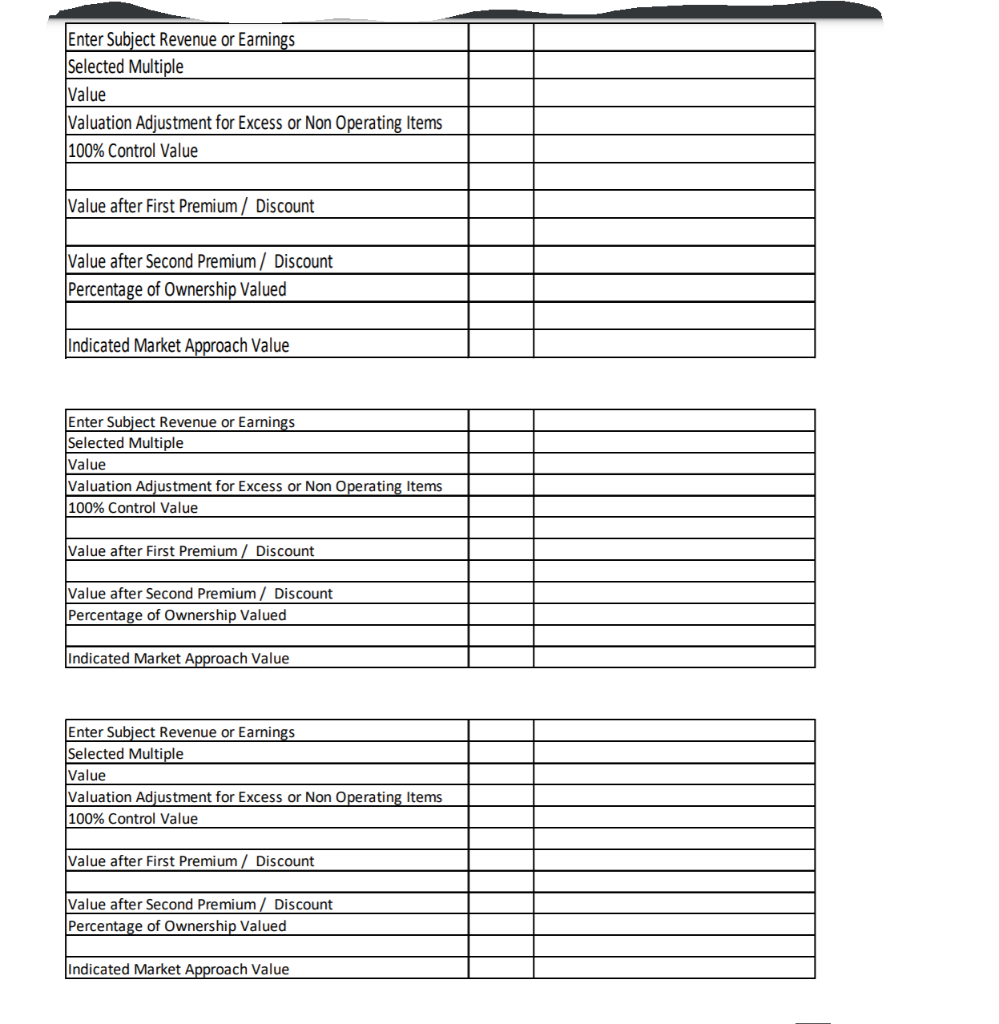
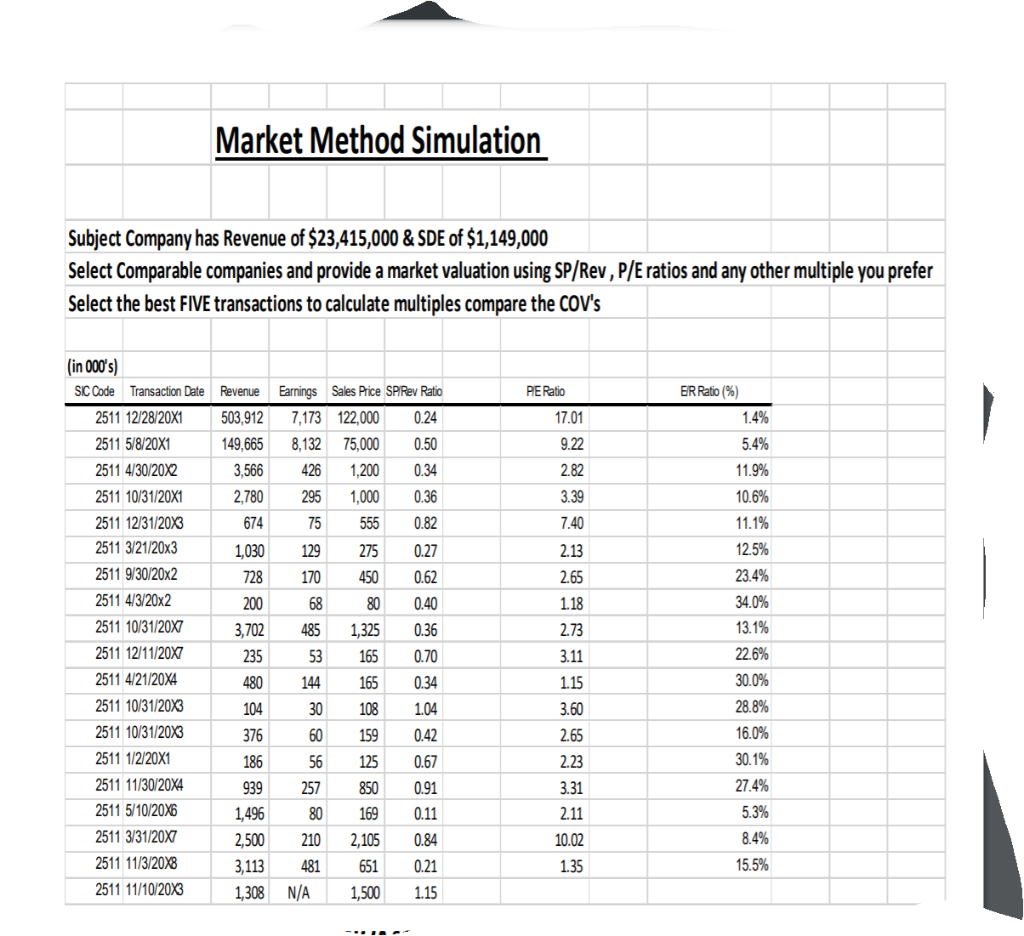
Enter Subject Revenue or Earnings Selected Multiple Value Valuation Adjustment for Excess or Non Operating Items 100% Control Value Value after First Premium / Discount Value after Second Premium / Discount Percentage of Ownership Valued Indicated Market Approach Value Enter Subject Revenue or Earnings Selected Multiple Value Valuation Adjustment for Excess or Non Operating Items 100% Control Value Value after First Premium / Discount Value after Second Premium / Discount Percentage of Ownership Valued Indicated Market Approach Value Enter Subject Revenue or Earnings Selected Multiple Value Valuation Adjustment for Excess or Non Operating Items 100% Control Value Value after First Premium / Discount Value after Second Premium / Discount Percentage of Ownership Valued Indicated Market Approach Value Market Method Simulation Subject Company has Revenue of $23,415,000 & SDE of $1,149,000 Select Comparable companies and provide a market valuation using SP/Rev , P/E ratios and any other multiple you prefer Select the best FIVE transactions to calculate multiples compare the COV's PE Ratio ER Ratio (%) 1.4% 5.4% 17.01 9.22 2.82 3.39 11.9% 10.6% 7.40 2.13 2.65 1.18 (in 000's) SIC Code Transaction Date Revenue 2511 12/28/20X1 503,912 2511 5/8/20X1 149.665 2511 4/30/20X2 3,566 2511 10/31/20X1 2,780 2511 12/31/20X3 674 2511 3/21/20x3 1,030 2511 9/30/20x2 728 2511 4/3/20x2 200 2511 10/31/20X7 3,702 2511 12/11/20X7 235 2511 4/21/20X4 480 2511 10/31/20X3 104 2511 10/31/20X3 376 2511 1/2/20X1 186 2511 11/30/20X4 939 2511 5/10/20X6 1,496 2511 3/31/20X7 2,500 2511 11/3/20X8 3,113 2511 11/10/20X3 1,308 Earnings Sales Price SP Rev Ratio 7,173 122,000 0.24 8.132 75.000 0.50 426 1,200 0.34 295 1,000 0.36 75 555 0.82 129 275 0.27 170 450 0.62 68 80 0.40 485 1,325 0.36 53 165 0.70 144 165 0.34 30 108 1.04 60 159 0.42 56 125 0.67 257 850 0.91 80 169 0.11 210 2,105 0.84 481 651 0.21 N/A 1,500 1.15 2.73 3.11 1.15 3.60 2.65 2.23 3.31 2.11 11.1% 12.5% 23.4% 34.0% 13.1% 22.6% 30.0% 28.8% 16.0% 30.1% 27.4% 5.3% 10.02 8.4% 15.5% 1.35 Enter Subject Revenue or Earnings Selected Multiple Value Valuation Adjustment for Excess or Non Operating Items 100% Control Value Value after First Premium / Discount Value after Second Premium / Discount Percentage of Ownership Valued Indicated Market Approach Value Enter Subject Revenue or Earnings Selected Multiple Value Valuation Adjustment for Excess or Non Operating Items 100% Control Value Value after First Premium / Discount Value after Second Premium / Discount Percentage of Ownership Valued Indicated Market Approach Value Enter Subject Revenue or Earnings Selected Multiple Value Valuation Adjustment for Excess or Non Operating Items 100% Control Value Value after First Premium / Discount Value after Second Premium / Discount Percentage of Ownership Valued Indicated Market Approach Value Market Method Simulation Subject Company has Revenue of $23,415,000 & SDE of $1,149,000 Select Comparable companies and provide a market valuation using SP/Rev , P/E ratios and any other multiple you prefer Select the best FIVE transactions to calculate multiples compare the COV's PE Ratio ER Ratio (%) 1.4% 5.4% 17.01 9.22 2.82 3.39 11.9% 10.6% 7.40 2.13 2.65 1.18 (in 000's) SIC Code Transaction Date Revenue 2511 12/28/20X1 503,912 2511 5/8/20X1 149.665 2511 4/30/20X2 3,566 2511 10/31/20X1 2,780 2511 12/31/20X3 674 2511 3/21/20x3 1,030 2511 9/30/20x2 728 2511 4/3/20x2 200 2511 10/31/20X7 3,702 2511 12/11/20X7 235 2511 4/21/20X4 480 2511 10/31/20X3 104 2511 10/31/20X3 376 2511 1/2/20X1 186 2511 11/30/20X4 939 2511 5/10/20X6 1,496 2511 3/31/20X7 2,500 2511 11/3/20X8 3,113 2511 11/10/20X3 1,308 Earnings Sales Price SP Rev Ratio 7,173 122,000 0.24 8.132 75.000 0.50 426 1,200 0.34 295 1,000 0.36 75 555 0.82 129 275 0.27 170 450 0.62 68 80 0.40 485 1,325 0.36 53 165 0.70 144 165 0.34 30 108 1.04 60 159 0.42 56 125 0.67 257 850 0.91 80 169 0.11 210 2,105 0.84 481 651 0.21 N/A 1,500 1.15 2.73 3.11 1.15 3.60 2.65 2.23 3.31 2.11 11.1% 12.5% 23.4% 34.0% 13.1% 22.6% 30.0% 28.8% 16.0% 30.1% 27.4% 5.3% 10.02 8.4% 15.5% 1.35
Step by Step Solution
There are 3 Steps involved in it

Get step-by-step solutions from verified subject matter experts