

Question: Equation: Comment on the above result by Fixed Effect model (both cross-sections and periods) and 2SLS (use the following instruments lp(-1 to -2) lpn(-1 to
Equation: 
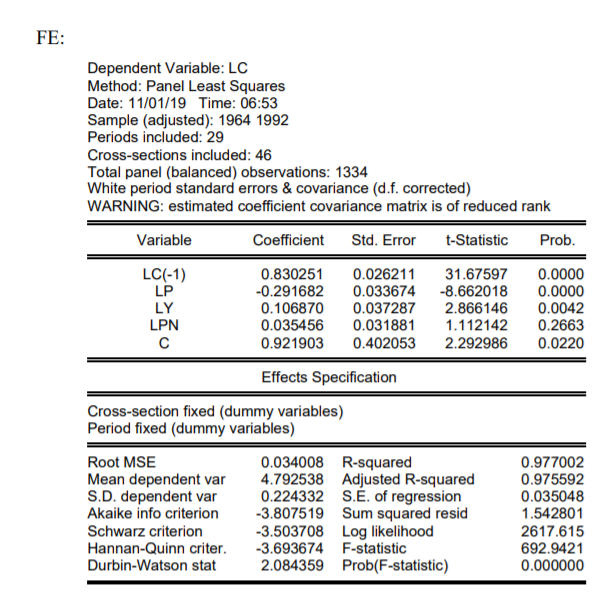
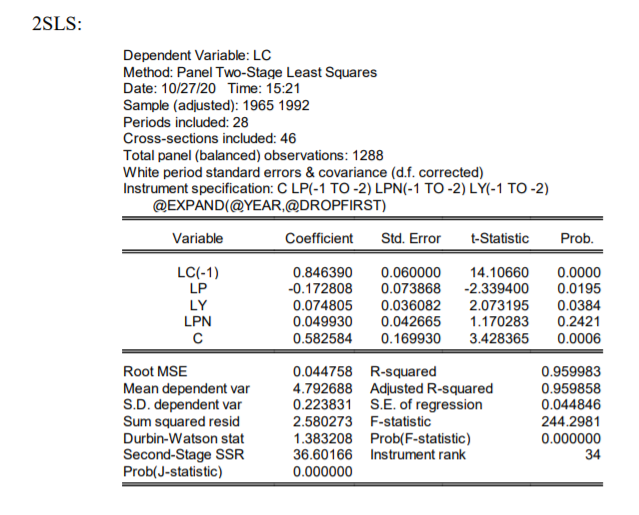
Comment on the above result by Fixed Effect model (both cross-sections and periods) and 2SLS (use the following instruments lp(-1 to -2) lpn(-1 to -2) ly(-1 to -2) @(EXPAND(@YEAR,@DROPFIRST) c for 2SLS).
FE: Dependent Variable: LC Method: Panel Least Squares Date: 11/01/19 Time: 06:53 Sample (adjusted): 1964 1992 Periods included: 29 Cross-sections included: 46 Total panel (balanced) observations: 1334 White period standard errors & covariance (d.f. corrected) WARNING: estimated coefficient covariance matrix is of reduced rank Variable Coefficient Std. Error t-Statistic Prob. LC(-1) LP LY LPN 0.830251 -0.291682 0.106870 0.035456 0.921903 0.026211 0.033674 0.037287 0.031881 0.402053 31.67597 -8.662018 2.866146 1.112142 2.292986 0.0000 0.0000 0.0042 0.2663 0.0220 Effects Specification Cross-section fixed (dummy variables) Period fixed (dummy variables) Root MSE 0.034008 R-squared Mean dependent var 4.792538 Adjusted R-squared S.D. dependent var 0.224332 S.. of regression Akaike info criterion -3.807519 Sum squared resid Schwarz criterion -3.503708 Log likelihood Hannan-Quinn criter. -3.693674 F-statistic Durbin-Watson stat 2.084359 Prob(F-statistic) 0.977002 0.975592 0.035048 1.542801 2617.615 692.9421 0.000000 2SLS: Dependent Variable: LC Method: Panel Two-Stage Least Squares Date: 10/27/20 Time: 15:21 Sample (adjusted): 1965 1992 Periods included: 28 Cross-sections included: 46 Total panel (balanced) observations: 1288 White period standard errors & covariance (d.f. corrected) Instrument specification: CLP(-1 TO-2) LPN(-1 TO-2) LY(-1 TO-2) @EXPANDI@YEAR, @DROPFIRST) Variable Coefficient Std. Error t-Statistic Prob. LC(-1) LP LY LPN 0.846390 -0.172808 0.074805 0.049930 0.582584 0.060000 0.073868 0.036082 0.042665 0.169930 14.10660 -2.339400 2.073195 1.170283 3.428365 0.0000 0.0195 0.0384 0.2421 0.0006 Root MSE Mean dependent var S.D. dependent var Sum squared resid Durbin-Watson stat Second-Stage SSR Prob(J-statistic) 0.044758 R-squared 4.792688 Adjusted R-squared 0.223831 S.E. of regression 2.580273 F-statistic 1.383208 Prob(F-statistic) 36.60166 Instrument rank 0.000000 0.959983 0.959858 0.044846 244.2981 0.000000 34 Log(C)= B:+B,Log(C;-1)+ B, log(P.)+B.log(Y)) + B, log(PN;) + e, FE: Dependent Variable: LC Method: Panel Least Squares Date: 11/01/19 Time: 06:53 Sample (adjusted): 1964 1992 Periods included: 29 Cross-sections included: 46 Total panel (balanced) observations: 1334 White period standard errors & covariance (d.f. corrected) WARNING: estimated coefficient covariance matrix is of reduced rank Variable Coefficient Std. Error t-Statistic Prob. LC(-1) LP LY LPN 0.830251 -0.291682 0.106870 0.035456 0.921903 0.026211 0.033674 0.037287 0.031881 0.402053 31.67597 -8.662018 2.866146 1.112142 2.292986 0.0000 0.0000 0.0042 0.2663 0.0220 Effects Specification Cross-section fixed (dummy variables) Period fixed (dummy variables) Root MSE 0.034008 R-squared Mean dependent var 4.792538 Adjusted R-squared S.D. dependent var 0.224332 S.. of regression Akaike info criterion -3.807519 Sum squared resid Schwarz criterion -3.503708 Log likelihood Hannan-Quinn criter. -3.693674 F-statistic Durbin-Watson stat 2.084359 Prob(F-statistic) 0.977002 0.975592 0.035048 1.542801 2617.615 692.9421 0.000000 2SLS: Dependent Variable: LC Method: Panel Two-Stage Least Squares Date: 10/27/20 Time: 15:21 Sample (adjusted): 1965 1992 Periods included: 28 Cross-sections included: 46 Total panel (balanced) observations: 1288 White period standard errors & covariance (d.f. corrected) Instrument specification: CLP(-1 TO-2) LPN(-1 TO-2) LY(-1 TO-2) @EXPANDI@YEAR, @DROPFIRST) Variable Coefficient Std. Error t-Statistic Prob. LC(-1) LP LY LPN 0.846390 -0.172808 0.074805 0.049930 0.582584 0.060000 0.073868 0.036082 0.042665 0.169930 14.10660 -2.339400 2.073195 1.170283 3.428365 0.0000 0.0195 0.0384 0.2421 0.0006 Root MSE Mean dependent var S.D. dependent var Sum squared resid Durbin-Watson stat Second-Stage SSR Prob(J-statistic) 0.044758 R-squared 4.792688 Adjusted R-squared 0.223831 S.E. of regression 2.580273 F-statistic 1.383208 Prob(F-statistic) 36.60166 Instrument rank 0.000000 0.959983 0.959858 0.044846 244.2981 0.000000 34 Log(C)= B:+B,Log(C;-1)+ B, log(P.)+B.log(Y)) + B, log(PN;) + eStep by Step Solution
There are 3 Steps involved in it
1 Expert Approved Answer
Step: 1 Unlock

Question Has Been Solved by an Expert!
Get step-by-step solutions from verified subject matter experts
Step: 2 Unlock
Step: 3 Unlock