

Question: er 14 - Assignment i Saved Help Save & Exit Submit Check my work The following chart shows how costs flow through a business as
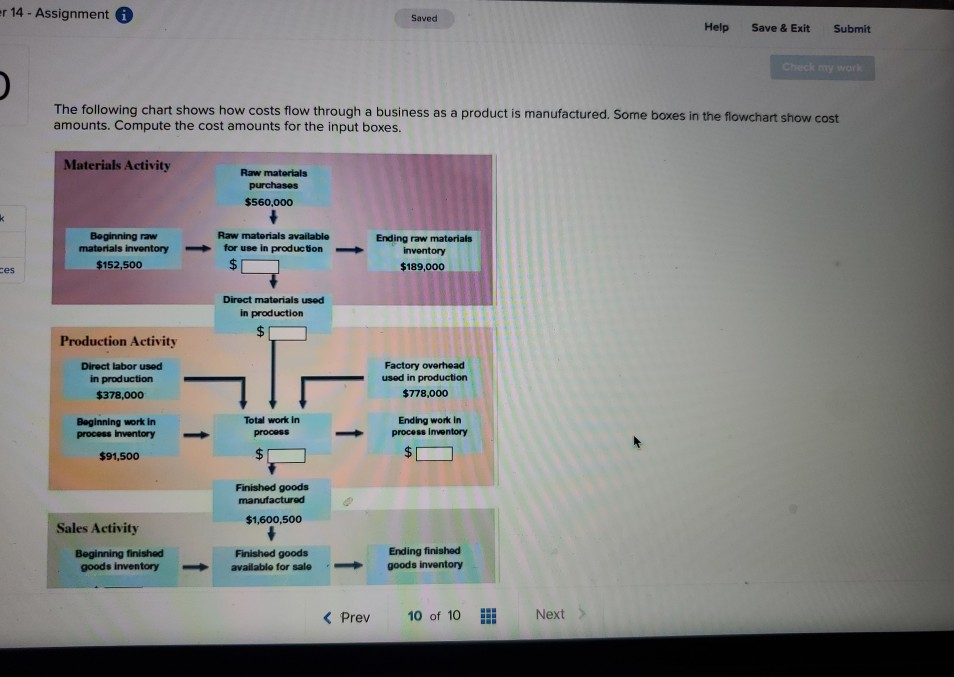
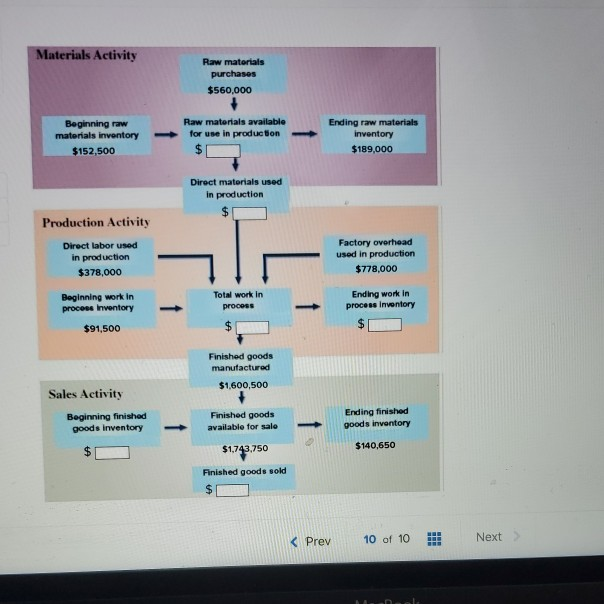
er 14 - Assignment i Saved Help Save & Exit Submit Check my work The following chart shows how costs flow through a business as a product is manufactured. Some boxes in the flowchart show cost amounts. Compute the cost amounts for the input boxes. Materials Activity Raw materials purchases $560,000 k Beginning raw materials inventory $152,500 Raw materials available for use in production - $ Ending raw materials inventory $189,000 ces Direct materials used in production Production Activity Direct labor used in production $378,000 Beginning work in process inventory $91,500 Factory overhead used in production $778,000 Total work in process $ Ending work in process Inventory Finished goods manufactured $1,600,500 Sales Activity Beginning finished goods Inventory Finished goods available for sale Ending finished goods inventory Materials Activity Raw materials purchases $560,000 Beginning raw materials inventory $152,500 Raw materials available for use in production - $ Ending raw materials inventory $189,000 Direct materials used in production Production Activity Direct labor used in production $378,000 Factory overhead used in production $778,000 Beginning work in process Inventory Total work in process $ Ending work in process Inventory $91,500 Finished goods manufactured $1,600,500 Sales Activity Beginning finished goods Inventory Finished goods available for sale Ending finished goods inventory $1,743,750 $140,650 Finished goods sold $
Step by Step Solution
There are 3 Steps involved in it

Get step-by-step solutions from verified subject matter experts