

Question: er browser&launchuria http%253A%252F%252Fwwconnectedcation.com%2528/activity/question 5 Homework Exercise 05-6 Cost behavior estimation scatter diagram and high-low LO P1 Felix & Co. reports the following information about its
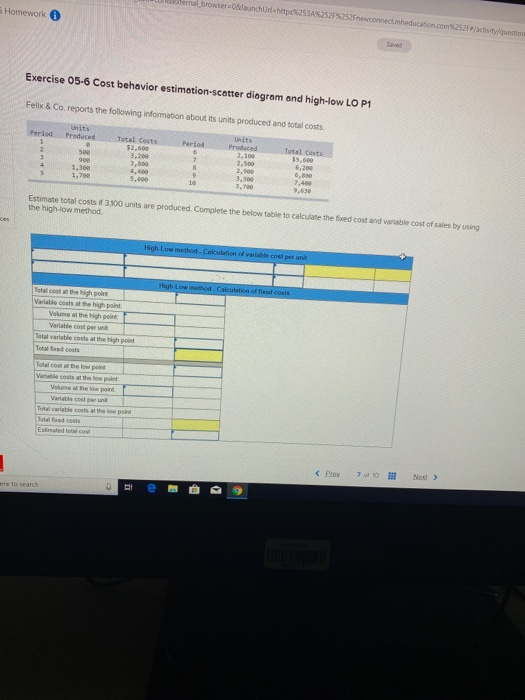
er browser&launchuria http%253A%252F%252Fwwconnectedcation.com%2528/activity/question 5 Homework Exercise 05-6 Cost behavior estimation scatter diagram and high-low LO P1 Felix & Co. reports the following information about its units produced and total costs Period 1 2 Tutal Costs 52.600 Units Produced 500 900 1.300 1,700 Produced Total Costs 3,200 3,800 4.400 5,000 5 2 8 9 1 2.100 2,500 2.900 3,300 3,700 6,200 6.600 7,400 Estimate total costs of 3.300 units are produced. Complete the below table to calculate the fixed cost and variable cost of sales by using the high-low method High-Luthod-Calculation of a cost per High Low method Calculation of feed costs Totalco the high point Vrtecosts the point Volume at the high point Variable content Total variables at the point Totalfred cost Total cost to polet costs at the low View the low point Total variable costs at the low point Estrated.com ere to seard D BE
Step by Step Solution
There are 3 Steps involved in it

Get step-by-step solutions from verified subject matter experts