

Question: ere is a bivariate data set. X y 42.6 193.1 68.6 -45.1 54.3 55.2 71.8 42 67.8 157.8 22.5 88.2 59.9 33.5 62 141.1 64.3
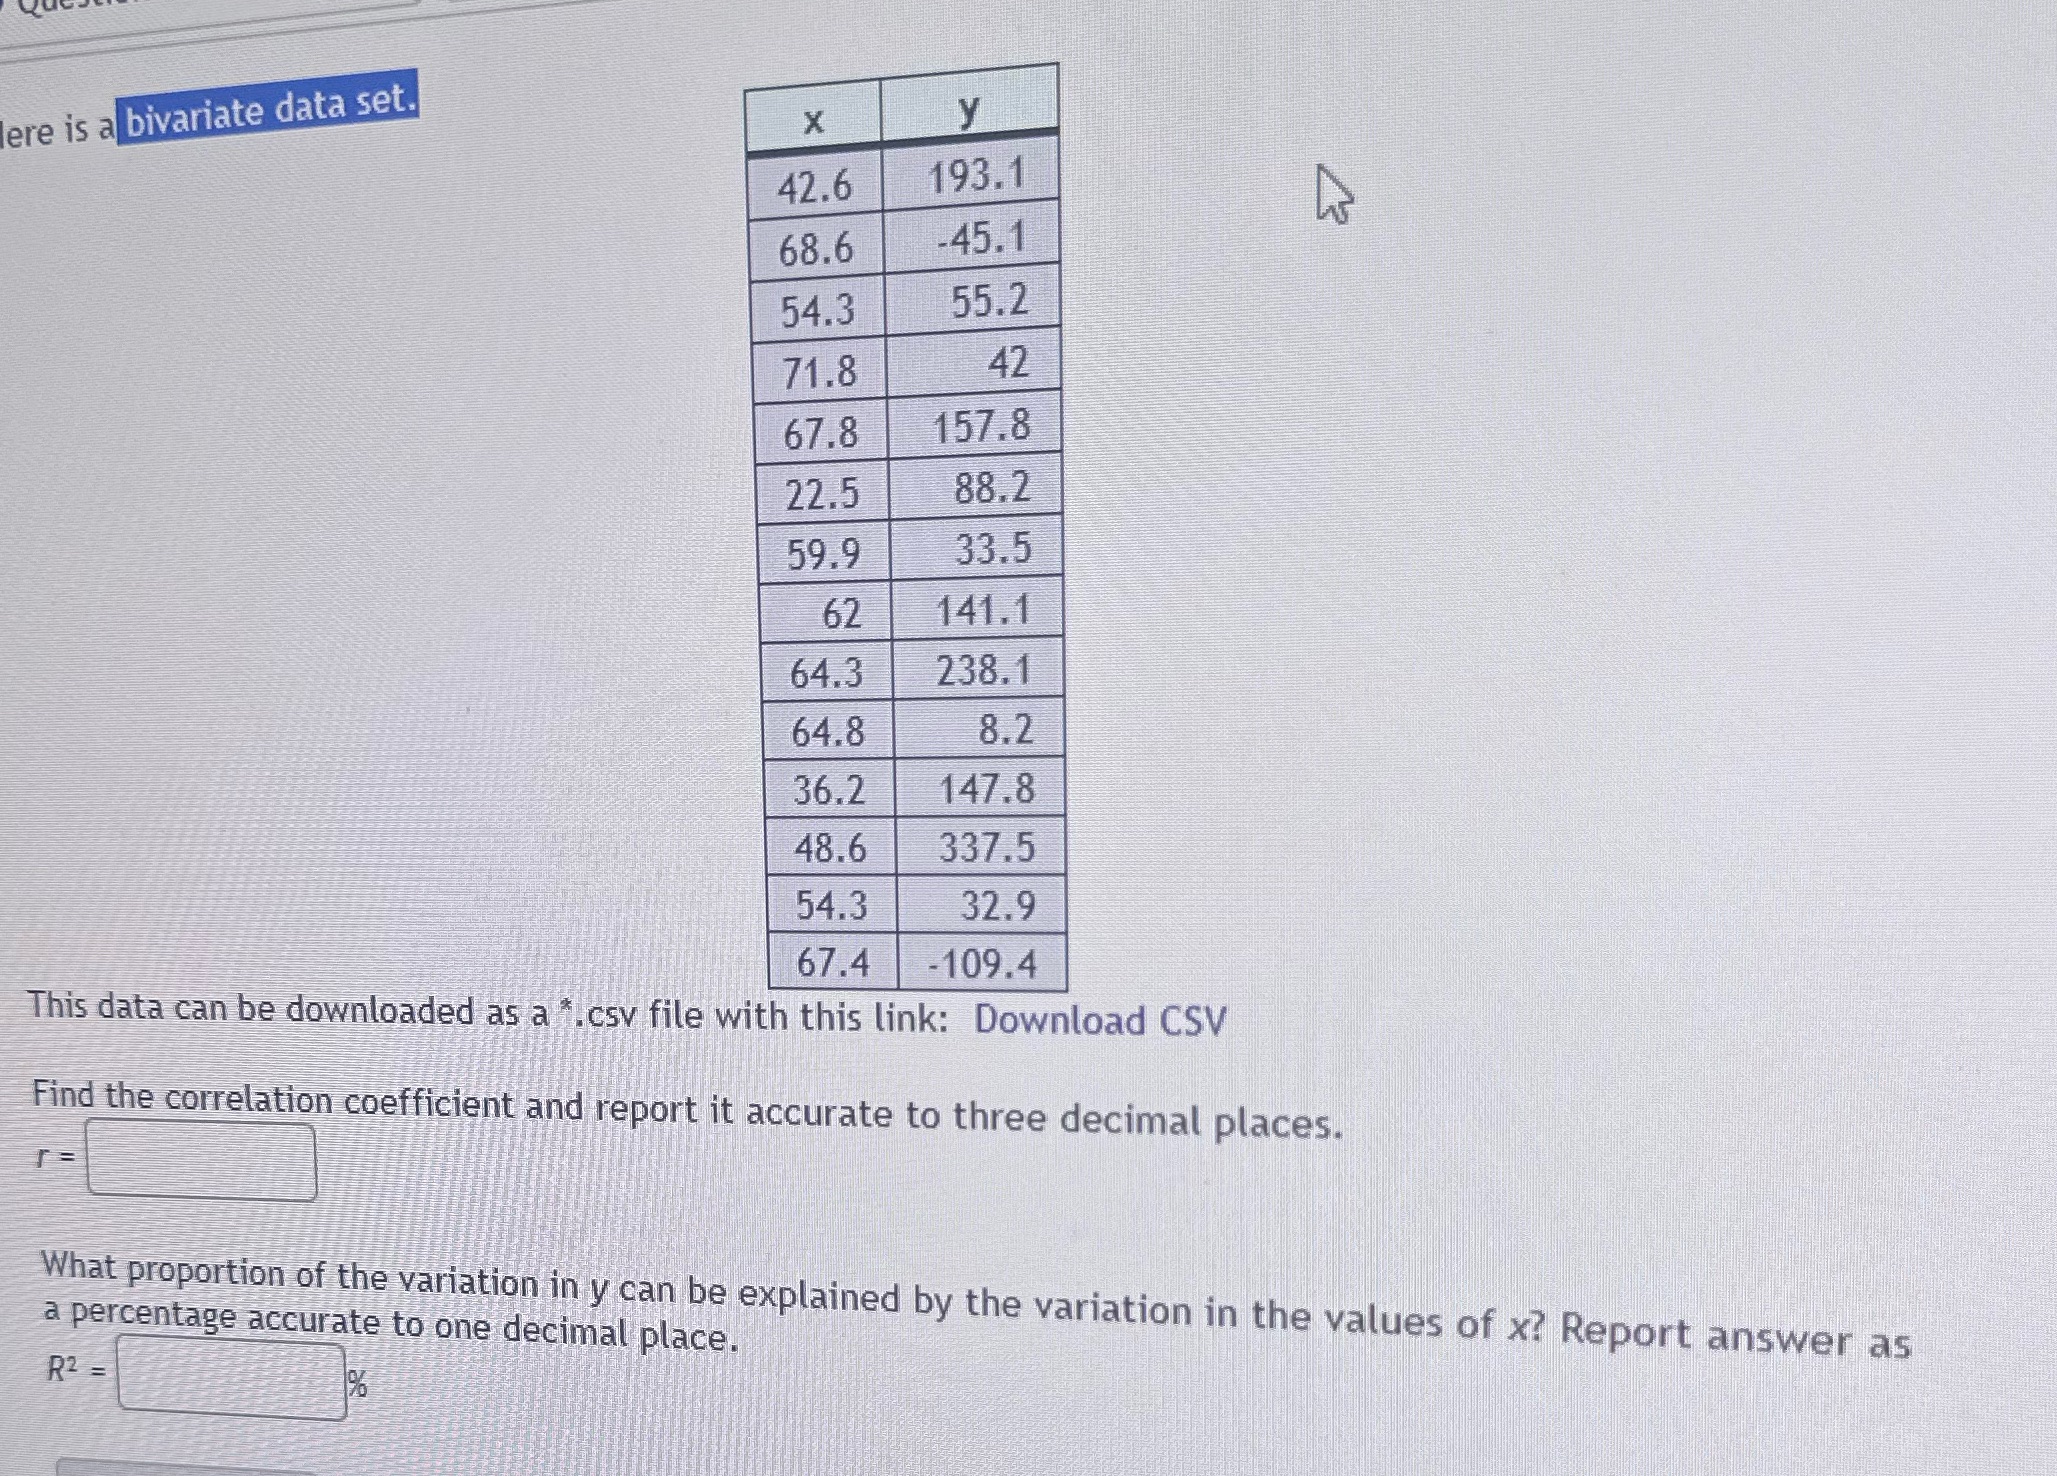
ere is a bivariate data set. X y 42.6 193.1 68.6 -45.1 54.3 55.2 71.8 42 67.8 157.8 22.5 88.2 59.9 33.5 62 141.1 64.3 238.1 64.8 8.2 36.2 147.8 48.6 337.5 54.3 32.9 67.4 - 109.4 This data can be downloaded as a *.csy file with this link: Download CSV Find the correlation coefficient and report it accurate to three decimal places. What proportion of the variation in y can be explained by the variation in the values of x? Report answer as a percentage accurate to one decimal place. R2 =
Step by Step Solution
There are 3 Steps involved in it
1 Expert Approved Answer
Step: 1 Unlock

Question Has Been Solved by an Expert!
Get step-by-step solutions from verified subject matter experts
Step: 2 Unlock
Step: 3 Unlock